What C.T.R. Wilson Saw
Charles Thomson Rees Wilson, better known for inventing the cloud chamber and sharing the 1927 Nobel Prize in Physics, spent much of the 1920s thinking about thunderstorms. Observers before him had noticed that the fair-weather atmosphere always has a downward electric field of roughly 100 to 150 V/m at the surface. Something had to be maintaining that field against the leakage current flowing through the finite-conductivity atmosphere. Wilson (1920, Philosophical Transactions; 1921, Proceedings of the Royal Society; 1929, Journal of the Franklin Institute) proposed that thunderstorms were the generators.
His argument was simple enough to state. Inside a thundercloud, charge separation places negative charge at the bottom and positive charge at the top, with the positive region near or above the freezing level. This produces a downward negative current from the cloud to the ground (the lightning channels plus point-discharge currents from surface features below the cloud) and an upward positive current from the top of the cloud toward the conducting upper atmosphere. Integrated over the roughly 1000 to 2000 thunderstorms active around the planet at any time, the upward current supplies about 1 kA to the conducting ionospheric layer above.
That layer then acts as an equipotential shell at approximately +250 kV. Far from any thunderstorm, the potential difference drives a downward fair-weather current back to ground. Measured at the surface, this gives the 130 V/m field that everyone sees in clean air.
The loop closes through the Earth's surface, which holds a net negative charge of approximately 6 times 10^5 coulombs. This is the planetary battery, and the thunderstorms are the alternators that keep it charged.
The Carnegie Expeditions
Between 1915 and 1929, the Carnegie Institution of Washington operated a non-magnetic research vessel, the R/V Carnegie, on four worldwide cruises. The ship was built without iron to allow precise magnetic and electrical measurements. Its primary mission was to map the Earth's magnetic field, but it also carried instruments for the atmospheric electric potential gradient, which equals the vertical electric field with the opposite sign.
Why at sea? Because ocean air is clean. The atmospheric electric field near cities is dominated by local pollution, ion sources, and space-charge effects. In the middle of the Pacific or Indian Ocean, the field reflects the background state of the global circuit with minimal interference. The Carnegie's cruises gave the first systematic record of the fair-weather field across the entire planet.
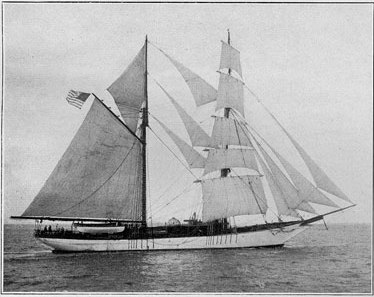
Source: Carnegie Institution of Washington, Department of Terrestrial Magnetism (public domain, published 1917).
The pattern that emerged was striking. When the ship's daily field measurements were averaged across many cruises and plotted against Universal Time, the result was a single smooth curve with:
- a broad minimum near 03 UT,
- a steady rise through the morning and afternoon,
- a single maximum near 19 UT,
- a decline back through the night.
The ship's geographic position did not matter. An observer in the Pacific at 19 UT saw the same elevated field that an observer in the Atlantic did at 19 UT. Local time, sunrise, and the ship's location dropped out of the signal. Only Universal Time controlled it.
The explanation came from Francis Whipple at the Meteorological Office. Whipple (1929, Quarterly Journal of the Royal Meteorological Society) and Whipple and Scrase (1936) compiled thunderstorm statistics ("thunder-day" records) from meteorological stations on every continent and summed the global diurnal thunderstorm area in Universal Time. The result tracked the Carnegie curve with a correlation coefficient of 0.93. The reason the global field peaks at 19 UT is that, at that hour, the Americas are in late afternoon, when continental thunderstorm activity is at its diurnal maximum. Earlier in the UT day, Africa is at its peak; later, the Maritime Continent of Southeast Asia takes over. The three "chimneys" of tropical thunderstorms, rotating with the Earth, produce a single aggregate UT signature.
The Carnegie curve became, and remains, the reference standard for atmospheric electricity measurements. When a modern researcher measures the fair-weather field at a remote site and wants to check whether the observation reflects the global circuit or local contamination, the comparison is against the Carnegie curve. Harrison (2013, Surveys in Geophysics 34) provides modern harmonic coefficients for computing the curve; Harrison (2020, History of Geo- and Space Sciences 11) traces the historical sources and resolves small transcription errors among secondary citations.
The Circuit in Numbers
Modern quantitative models of the Global Electric Circuit, developed by Rycroft and colleagues (Rycroft et al. 2000, 2007; Rycroft and Odzimek 2010; Rycroft et al. 2025) using circuit-simulation software, produce the following typical values for the DC circuit in steady state:
| Quantity | Value |
|---|---|
| Ionospheric potential (V) | ~+250 kV |
| Total circuit current (I) | ~1 to 1.4 kA |
| Fair-weather current density (J) | ~2 pA/m² |
| Fair-weather surface field (E) | ~130 V/m (pointing downward) |
| Net Earth surface charge (Q) | ~-6 × 10&sup5; C |
| Columnar resistance | ~250 Ω |
| Circuit time constant (τ) | ~8 to 12 min |
| Thunderstorms contributing | ~60 to 80% of upward current |
| Electrified shower clouds contributing | ~20 to 40% of upward current |
A single negative cloud-to-ground lightning stroke, transferring about -7 C of charge from 5 km altitude to the ground, raises the ionospheric potential transiently by about 4 kV before the circuit relaxes back to equilibrium over 200 seconds (Rycroft and Odzimek 2010). Averaged over the global flash rate of about 50 per second, cloud-to-ground lightning contributes only a few percent of the total current; most of the charging is done by the slower continuous currents from the thousands of active thunderstorm cells.
The Earth's capacitance, in this picture, is about 1.5 F. The time constant τ = RC with R ~ 250 Ω and C ~ 1.5 F gives τ ~ 6 minutes, consistent with the modelled value and with the observed relaxation after volcanic lightning events (Rycroft et al. 2025).
DC and AC: Two Faces of the Same System
The Global Electric Circuit as described so far is a DC system. The Schumann resonance, the signal EarthBeat displays, is the AC counterpart. Both live inside the same Earth-ionosphere cavity and are driven by the same global lightning, but they respond to different aspects of the lightning signal.
The DC system (GEC). Every lightning discharge contributes a small step to the ionospheric charge and a small step to the Earth's surface charge. Averaged over the circuit's relaxation time of about 10 minutes, these steps integrate into a steady ionospheric potential around +250 kV. The DC system responds to the total worldwide lightning current, slowly averaged. What varies on the diurnal scale is the distribution of active thunderstorms across the three tropical chimneys, and that is what the Carnegie curve traces.
The AC system (Schumann resonance). Each individual lightning stroke is a brief, broadband current pulse. The pulse radiates electromagnetic energy at all frequencies, and the subset that falls into the cavity's resonant bands (near 7.83, 14.3, 20.8, 27.3, and 33.8 Hz) sets up standing waves around the planet. What varies on the diurnal scale here is also the chimney positions, but the measured quantity is the amplitude and frequency of the ELF resonance, not the DC electric field.
The two systems share a common conductivity profile of the lower ionosphere, but measurements made in each have historically produced slightly different inferred height profiles. Nickolaenko, Hayakawa, and colleagues (2016, Radiophysics and Quantum Electronics) resolved this by combining DC and AC data into a hybrid conductivity profile. The DC properties dominate near the surface where the atmospheric resistance is concentrated; the AC (Schumann resonance) properties dominate in the middle atmosphere between 40 and 100 km, where the wave propagation happens.
Aplin, Harrison, and Rycroft (2008, Space Science Reviews) argued that the Schumann resonance is the single most useful measurement for confirming the existence of a global electric circuit on another planet. The GEC as a whole is hard to observe directly because it is a DC phenomenon spread across the entire atmosphere. The Schumann resonance concentrates into a few narrow frequency bands and is detectable from a single station. See The Schumann Resonance on Other Planets for how this applies beyond Earth.
The Three Chimneys, Seen Two Ways
The diurnal pattern in both the Carnegie curve and the Schumann resonance amplitude comes from the same three-source geography.
African chimney (06-12 UT peak). Central Africa, particularly the Congo basin, hosts the world's most intense thunderstorm activity per unit area. Its afternoon convection peaks in UTC morning.
American chimney (18-22 UT peak). The Amazon basin and continental North America together produce the global maximum of lightning in the late UT afternoon. This is when the Carnegie curve reaches its highest value.
Maritime Continent chimney (08-10 UT peak). Indonesia, Malaysia, and northern Australia produce strong afternoon convection in UT morning. This is the source that makes the morning part of the Carnegie curve non-zero.
The three chimneys together give the global field a single broad peak per UT day, not three sharp peaks, because their diurnal cycles overlap and the circuit's long time constant smooths the result. In the Schumann resonance record, the same three sources produce distinct amplitude signatures in each mode at the UT hours when each chimney is active, and the decomposition of the SR spectrum by UT hour is one of the standard ways to monitor lightning distribution from a single observatory.
Why the Circuit Matters
The GEC framework does three things that the Schumann resonance on its own cannot.
It connects lightning to climate. Because the fair-weather current density is sensitive to the tropical thunderstorm rate, and thunderstorm rate is sensitive to surface temperature, the GEC has been proposed as an independent climate indicator. Price (1993) estimated that a 1 K rise in global surface temperature corresponds to a 20 percent rise in the ionospheric potential. This is consistent with the Schumann-resonance-as-thermometer argument covered on the climate page, but works through the DC rather than the AC pathway.
It connects solar activity to the troposphere. Galactic cosmic rays ionise the atmosphere above a few kilometres, setting the columnar resistance. Solar activity modulates the galactic cosmic ray flux, so the fair-weather conductivity, and therefore the total circuit current, tracks the solar cycle. This is part of why the Schumann resonance intensity shows an 11-year modulation (see the solar flares page), and it is also one of the mechanisms invoked in cosmic-ray-cloud-climate hypotheses (Kirkby et al. 2011, Nature, from the CERN CLOUD experiment).
It provides a framework for transient events. Sprites, elves, blue jets, and other transient luminous events are not separate phenomena grafted onto the GEC; they are discharges that relieve the potential differences the circuit maintains. Rycroft and Odzimek (2010) showed that a positive cloud-to-ground stroke with a sufficient charge moment can briefly drop the ionospheric potential by 40 V, enough to trigger a sprite in the mesosphere. The sprite in turn leaves a signature in the Schumann resonance record as a "Q-burst" (Boccippio et al. 1995).
How to Think About This in EarthBeat
EarthBeat displays the Schumann resonance, which is one aspect of the Global Electric Circuit. The weekly spectrograms the app generates are effectively a slow-motion record of global lightning activity modulated by the three chimneys, which is the same signal the Carnegie captured a century ago, recorded through a different physical channel.
Two practical uses follow from the GEC framework.
Interpreting diurnal patterns. If EarthBeat's amplitude trace shows a broad peak near 18 to 20 UT and a dip near 03 to 04 UT, that is the American chimney's contribution to the planet's electromagnetic heartbeat. It is exactly what the Carnegie measured in 1915 to 1929, recorded now through an ELF receiver rather than a field mill, and it tracks Universal Time rather than local time for the same reason.
Interpreting cross-pattern behaviour. A day with unusually low SR amplitude and unusually low fair-weather field (if you were measuring that independently) likely has genuinely lower global lightning activity, not an instrument artefact, because the two signals come from the same physical source. This is the reasoning behind Aplin, Harrison, and Rycroft's (2008) argument that SR is the most efficient single-measurement diagnostic of a planet's electric circuit.
Summary
- The Global Electric Circuit is a DC system powered by thunderstorms that maintains the ionosphere at about +250 kV, drives a fair-weather current of about 2 pA/m squared everywhere, and keeps the Earth's surface charged to about -6 times 10^5 coulombs.
- The Carnegie curve is the 24-hour variation of this fair-weather field, peaking near 19 UT and minimising near 03 UT. It was established by the R/V Carnegie cruises of 1915 to 1929 and has been the reference standard for atmospheric electricity ever since.
- The Carnegie curve correlates at r = 0.93 with the diurnal variation of global thunderstorm area. The three tropical thunderstorm chimneys (Africa, Americas, Maritime Continent) drive both the Carnegie curve and the Schumann resonance amplitude modulation.
- The Global Electric Circuit and the Schumann resonance are the DC and AC faces of the same electromagnetic system. The DC side was mapped a century ago; the AC side is what EarthBeat displays in real time.
- The framework connects global lightning to climate, to solar activity, and to transient luminous events, and has been proposed as the most efficient signal for detecting global electric circuits on other planets.