The Chain: Temperature, Lightning, Resonance
The physical argument has three steps.
Temperature drives lightning. Warmer surface air produces stronger convection. Stronger convection lifts more water vapor past the freezing level, where graupel, hail, and supercooled droplets collide and separate electrical charge. The resulting vertical electric field eventually exceeds the breakdown strength of air, producing a lightning discharge. The relationship between surface temperature and flash rate is not linear. A modest temperature increase produces a disproportionately large rise in lightning activity. Williams (1992) characterised this as a natural amplifier: the nonlinearity makes a faint temperature signal loud in the lightning record.
Lightning drives the Schumann resonance. Each cloud-to-ground discharge is a brief but powerful current pulse that radiates electromagnetic energy across a wide frequency range, including the 3 to 60 Hz band where the Earth-ionosphere cavity resonates. About 50 flashes per second globally, sustained around the clock, keep the cavity continuously excited. The cavity's first five modes (approximately 7.83, 14.3, 20.8, 27.3, and 33.8 Hz) appear as persistent spectral peaks.
Cavity geometry records the source. The peak frequencies and intensities of the Schumann resonance depend on where on Earth the lightning is and where the observer is, because the cavity is a distributed resonator. Different modes peak at different UT hours as the three tropical thunderstorm chimneys (Amazon basin, central Africa, Maritime Continent) rotate through their local afternoons. This gives a diurnal signature that can be decomposed into contributions from each chimney, and therefore into a proxy for lightning distribution and intensity over multi-day to multi-year windows.
What Williams Found in 1992
Williams analysed data from the ELF receiver at West Greenwich, Rhode Island, covering the period from 1969 to 1974. The site had been operated for other purposes but produced a clean long-term record of Schumann resonance intensity. He compared it against the Hansen and Lebedeff global surface temperature anomaly series.
The two traces moved together. Months with higher global temperature anomaly showed higher Schumann resonance intensity, and vice versa. The period included two warm and two cold phases of the El Nino Southern Oscillation, which provided natural variability against which to test the correlation. The proposed mechanism (deep convection plus ice microphysics) was already established in meteorology. Williams' contribution was to connect it to the Schumann resonance record and to argue that SR intensity could serve as a cheap, single-station thermometer for the tropical atmosphere.
The paper ended with a suggestion: if long-term SR records existed, they could be used to monitor climate variability without relying on the weather station network. That suggestion has shaped the field since.
Follow-On Studies and the Surface Temperature Link
Balling and Hildebrandt (2000), working at Arizona State University and Southern Illinois University-Edwardsville, tested the correlation more rigorously. They compared Schumann resonance peak frequency data from Rhode Island against daily and monthly temperature estimates from satellite records and surface thermometer networks. The linkage held for daily and monthly timescales. The temperatures from subtropical and tropical latitudes dominated the relationship, consistent with the physical picture that most lightning (and therefore most of the SR signal) originates in those bands.
Sekiguchi, Hayakawa, Nickolaenko and Hobara (2006), working with data from stations in Japan and elsewhere, extended the analysis using principal component methods. They found cross-correlation coefficients as high as 0.9 between Schumann resonance intensity and global ground temperature across the 45 S to 45 N latitude band. The correlation decreased when the latitude interval was narrowed, confirming that mid-latitude lightning also contributes meaningfully to the SR record, not just the tropics.
Multiple independent stations have since reported consistent behavior: Nagycenk in Hungary (operated by the Geodetic and Geophysical Institute, one of the longest records available), Moshiri in Japan, Hornsund on Svalbard, Eskdalemuir in the UK, Alberta in Canada, Boulder Creek in California, and sites in Israel. The agreement across geographically distributed stations is one of the stronger arguments for treating SR intensity as a genuine global signal rather than a local artefact.
From Temperature to Water Vapor
A separate but related line of research, led by Colin Price at Tel Aviv University, connects Schumann resonance observations to upper tropospheric water vapor (UTWV).
UTWV is central to the climate sensitivity question. Water vapor is a greenhouse gas, and small changes in its concentration at high altitudes have large effects on Earth's radiation budget. UTWV is also hard to monitor directly: satellites measure it intermittently, surface instruments cannot see it, and the total column mass is small compared to lower-atmosphere humidity. Continuous monitoring of UTWV on multi-decadal scales is a known gap in the climate observation system.
Price (2000, published in Nature) proposed that tropical lightning activity could serve as a proxy for UTWV, because the deep convective storms that produce lightning are the same storms that transport water vapor into the upper troposphere. Price and Asfur (2006) refined this in the Bulletin of the American Meteorological Society, showing that daily Schumann resonance amplitude at a single ELF station in the Negev Desert led daily UTWV variations over Africa by roughly one day. The one-day lag matches the time for convective detrainment to move water into the upper troposphere.
Price et al. (2023), in the Journal of Geophysical Research: Atmospheres, revisited the relationship using modern satellite lightning detection (WWLLN, TRMM LIS) and the ERA5 reanalysis product. The temperature-lightning-UTWV linkage held in the updated data. This is relevant to climate projection because water vapor feedback is one of the largest uncertainties in climate sensitivity estimates, and SR-based UTWV monitoring is one of the few continuous long-term techniques that can constrain the feedback from ground-based measurements.
What El Nino Shows Us
The clearest test of the SR-as-thermometer hypothesis in recent years has been El Nino.
Williams et al. (2021), publishing in the Journal of Geophysical Research: Atmospheres, analysed Schumann resonance intensity records from six distant stations (Nagycenk, Hornsund, Eskdalemuir, Alberta, Boulder Creek, and Rhode Island) spanning the two most recent super El Nino events: 1997/98 and 2015/16. Both events showed the same pattern: SR intensity increased by tens of percent to several hundred percent during the transition months leading into each warm phase. The increase was not uniform geographically. In 1997 the rise showed up most strongly in the African and Maritime Continent chimneys. In 2015 it showed up more in South America and the Maritime Continent.
The common behaviour across two events separated by nearly two decades, observed at stations on five continents, is strong evidence that Schumann resonance intensity responds coherently to El Nino-scale changes in global atmospheric circulation. It also suggests the SR signal can act as a precursor for ENSO transitions, because the rise appears ahead of the oceanic signature.
Satori et al. (2024), using the long Nagycenk record, showed that the daily frequency range of the vertical electric SR component tracks meridional shifts in lightning activity during ENSO transitions. This refines the picture from "intensity goes up during warm events" to "the spatial distribution of lightning shifts measurably during transitions", giving a richer set of SR-derived climate diagnostics.
Limits of the Method
The Schumann resonance thermometer is a useful proxy, not a substitute for the full climate observing system. Several caveats apply.
Latitude coverage. The SR signal is dominated by tropical and subtropical lightning. Polar temperature trends, which are important for climate (especially through ice-albedo feedback), do not appear clearly in the SR record. The method measures what the tropics do, not what Earth as a whole does.
Station-specific effects. Single-station SR records are contaminated by ionospheric variations, local electromagnetic noise, solar cycle effects on D-region conductivity, and the day-night asymmetry of the cavity. Multi-station analysis reduces these effects but does not eliminate them. The interpretation requires careful separation of source changes from propagation changes.
Calibration across decades is hard. Instruments change, sites change, and continuous records longer than 30 years are rare. The longest usable record (Nagycenk, from the early 1990s onward) is shorter than the timescale needed to detect anthropogenic trends robustly. Multi-station composites (as in Williams et al., 2021) help but do not fully solve the problem.
The signal is integrated. SR intensity reports total global lightning activity weighted by the cavity propagation function. It cannot, on its own, distinguish between "more lightning per storm" and "more storms". Additional data from satellite optical transient detectors (OTD, LIS on TRMM, GLM on GOES) is needed to resolve that distinction.
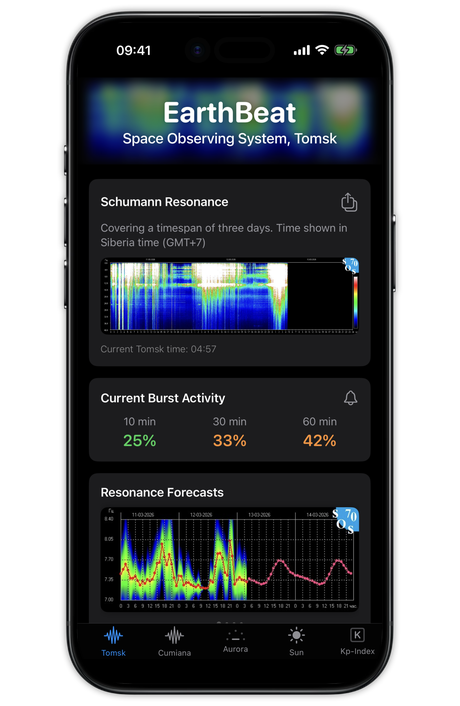
How to See It in EarthBeat
EarthBeat displays Schumann resonance data from two observatories, Tomsk in Russia and Cumiana in Italy. Neither is used in academic climate research at the intensity-normalisation level needed for trend detection, but both show the same diurnal and seasonal variations that carry the climate signal.
To see the thermometer effect with the app:
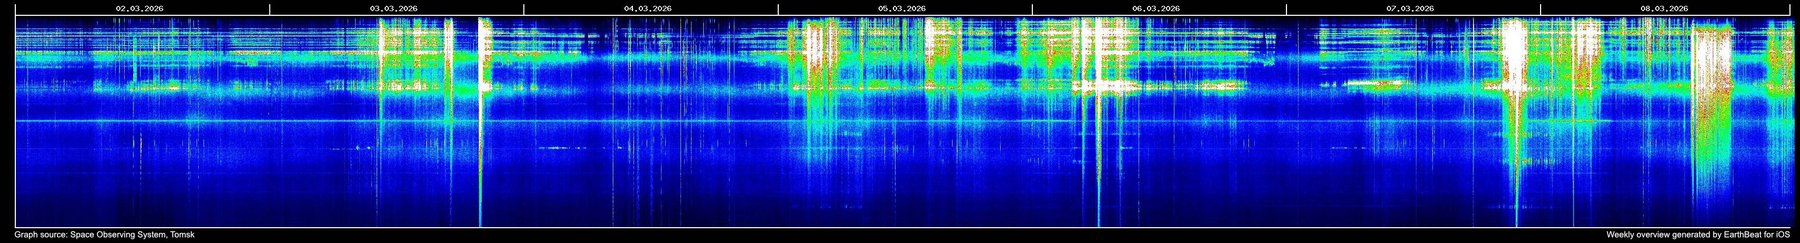
- In the weekly Schumann resonance overview (Pro feature), note the peak amplitude of the first three modes during the local afternoon hours of each major tropical region: roughly 12 to 18 UTC for Africa, 18 to 24 UTC for South America, and 06 to 12 UTC for the Maritime Continent.
- Compare the same UTC windows across consecutive weeks, months, and seasons. You will see the Maritime Continent contribution rise during the local wet season, the African contribution stay strongest through most of the year, and the South American contribution rise during the local wet season.
- During a confirmed strong El Nino phase (consult NOAA's ENSO bulletin), watch for a multi-week uplift in the Maritime Continent and African intensity windows. This is the same effect documented in Williams et al. (2021).
The exercise will not give you a climate-research-grade analysis, but it will let you see the same pattern the peer-reviewed literature describes, from the data stream that drives the app.
Summary
The Schumann resonance is the electromagnetic signature of global lightning, and global lightning is a thermodynamic response to tropical surface temperature. That chain, first put into the climate-science literature by Williams in 1992, has held up across follow-on studies by Balling and Hildebrandt, Sekiguchi, Price, Satori and others. The SR record tracks temperature, tracks upper tropospheric water vapor with a one-day lag, and shows coherent responses to El Nino transitions at stations thousands of kilometers apart. It is not a complete climate record, but it is one of the few continuous global climate proxies that a small number of quiet ground stations can produce. EarthBeat's display of Tomsk and Cumiana data is not calibrated for research use, but it does show the same diurnal and seasonal structure that makes the climate signal visible.