The Three Timescales
A flare on the Sun reaches Earth as three separate arrivals, each affecting the Schumann resonance differently.
Light and X-rays arrive first. Photons travel the Sun-Earth distance in about 8 minutes. Soft X-rays (roughly 0.1 to 0.8 nm, the GOES 1-8 A band) penetrate the atmosphere down to the upper D-region, around 70 to 85 km, and ionise neutral air there. This is the fast pathway, and it is what people mean when they talk about a "sudden ionospheric disturbance" (SID).
Energetic protons arrive next. Solar Proton Events (SPEs), when they occur, produce protons with energies up to ~100 MeV that arrive minutes to hours after the flare peak. These particles are guided by Earth's magnetic field into the polar caps, where they penetrate deeper, down to 50 to 60 km, and ionise the lower D-region.
The coronal mass ejection arrives days later. A CME, if one is launched, takes typically 1 to 3 days to reach Earth and drives the geomagnetic storm that shows up in Kp and Hp60. The SR effects of the storm itself are covered on a different page.
The X-ray and proton pathways are the ones that matter for the Schumann resonance in the minutes-to-hours timescale that most observers notice.
X-Ray Bursts: the Fast, Global Response
Soft X-rays from a flare ionise the upper D-region on the sunlit hemisphere within seconds of reaching Earth. Because the cavity is a global resonator, the resulting change in the ionosphere's effective reflection height changes the resonance frequencies measured everywhere, including at nightside stations. This is one of the more counterintuitive results in the field: a flare above one hemisphere modifies the first-mode frequency recorded on the opposite side of the planet.
The effect was searched for from the late 1960s onwards but was hard to isolate because the regular diurnal variation of SR frequency (caused by the rotating day-night terminator) is larger than a typical flare response. The breakthrough came with two approaches. Satori, Williams, and Mushtak (2005, Journal of Atmospheric and Solar-Terrestrial Physics 67) used multi-station comparisons. Shvets, Nickolaenko, and Belyaev (2017, Radiophysics and Quantum Electronics 60[3]) introduced a weighted average frequency (WAF) technique that combines all five modes to reveal the flare signal hidden beneath the diurnal variation.
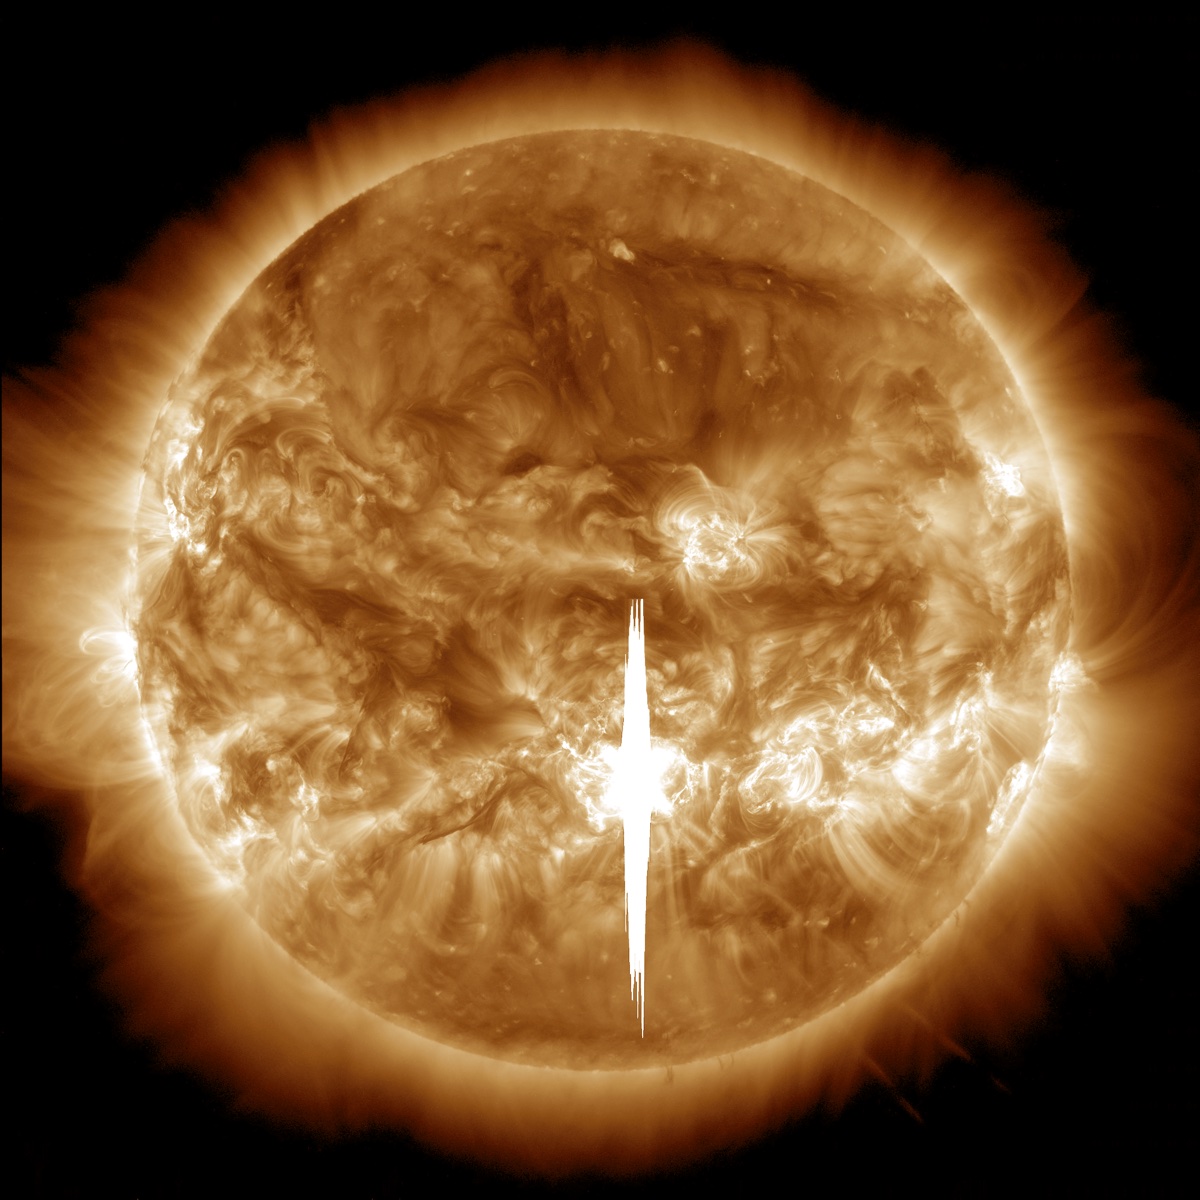
Source: NASA / Solar Dynamics Observatory.
Representative observational results:
- Roldugin et al. (2004, Journal of Geophysical Research 109). First mode frequency increases of 0.1 to 0.3 Hz during X-ray bursts recorded on the Kola Peninsula.
- Dyrda et al. (2015, JGR Space Physics 120). Spectral decomposition of all five modes during an X2.1 flare on a 5-minute timescale. All mode frequencies shifted in the same direction simultaneously; Q factors also changed.
- Zhou and Qiao (2015). First-mode frequency at the YS station (China) increased by 0.1 to 0.2 Hz during the X5.4 flare of 7 March 2012.
- Singh et al. (2014, JASTP 113). Observations at Agra, India (27.2 N) showed first-mode frequency increases of 8.4% and 10.9% during two X-ray bursts.
- Shvets et al. (2017). Across a set of X-class flares, the shift in weighted average frequency follows an empirical law of the form Δf proportional to log(X-ray intensity)^1.7.
The effect scales roughly with the logarithm of X-ray flux, not linearly. A C-class flare produces a barely-detectable signature; an X-class flare produces a clear shift visible in real-time processing.
Why X-Ray Bursts Push the Frequency Up
The classical framework here is the two-layer model first written down by Greifinger and Greifinger (1978, Radio Science 13) and since refined by many authors. In this model the cavity's resonance frequencies are governed by two characteristic heights:
- h_E (electric height), around 50 to 60 km. This is where displacement current equals conduction current. It is set by the conductivity of the lower D-region.
- h_L (magnetic height), around 90 to 100 km. This is higher up, in the E-region, where the waves "see" the upper wall of the cavity.
The first-mode frequency is roughly proportional to c / (2π sqrt(h_E · h_L)), where c is the speed of light in vacuum. When either characteristic height drops, the frequency rises.
X-ray bursts ionise mainly the upper D-region, around 70 to 80 km. This is above h_E but at or around h_L. Increased ionisation there drops h_L by a few kilometres, and the resonance frequencies rise. Zhou and Qiao (2015) state the rule clearly: the SR frequencies increase when conductivity above roughly 60 to 70 km is enhanced, because h_L is lowered; they decrease when conductivity below that altitude is enhanced, because h_E is lowered. This single rule, with opposite signs of the two heights' contributions, accounts for the opposite response of SR to X-ray bursts versus proton events.
During a typical X-class flare the magnetic height drops by several kilometres. During the largest events the displacement can approach 10 km.
Solar Proton Events: the Slower, Polar-Cap Response
Protons from a flare, when the flare is eruptive enough to accelerate them, arrive over minutes to a few hours and are channelled by the geomagnetic field into the polar caps. There they penetrate significantly deeper than X-rays, reaching 50 to 60 km in the lower D-region, sometimes down to 40 km during the largest events. This is a polar-cap effect, not a sunlit-hemisphere effect, and it modifies h_E rather than h_L.
Because h_E drops, the SR frequencies drop with it. This is the opposite sign from the X-ray response, and it is one of the cleanest experimental checks of the two-layer model.
Observational record:
- Roldugin, Maltsev, Vasiljev (2001, 2003). Kola Peninsula observations during the solar proton events of 4 and 6 November 1997 and 2 and 6 May 1998. First-mode frequency decreased by about 0.15 Hz at the proton-flux peak.
- Schlegel and Fullekrug (1999, Journal of Geophysical Research 104). Systematic analysis of SR parameter changes during high-energy particle precipitation events, establishing the SPE-SR link.
- De, Sasmal, Chakrabarti (2010); De et al. (2016). Kolkata observations during the 7 March 2012 event. First-mode frequency rose by 3.85% during the X-ray burst, then fell by 5.13% during the subsequent proton event.
- Zhou and Qiao (2015). During the same 7 March 2012 event the first-mode frequency of the east-west magnetic field component dropped by up to 0.6 Hz during the proton flux peak. The north-south component was less affected, reflecting the asymmetric source-observer geometry.
- Singh et al. (2014). Low-latitude Agra observations during the 22 September 2011 and 6 July 2012 events showed frequency decreases of 4.3% and 3.3% associated with the SPE peaks.
An event like the 14 July 2000 "Bastille Day" SPE or the 28 October 2003 "Halloween" events are strong enough to change the effective lower-ionosphere altitude by tens of kilometres in the polar cap.
The 11-Year Solar Cycle
The same physics runs on a longer clock. Over the 11-year solar cycle the integrated X-ray flux, EUV flux, and 10.7 cm radio flux all rise and fall together, and the ionosphere's reflection height follows.
The landmark long-duration study is Nickolaenko, Shvets, Koloskov, Yampolski, Budanov and Beggan (2025, Atmosphere 16[6], 648), using 22 years of continuous SR records from the Ukrainian Antarctic Station Akademik Vernadsky (65.25 S, 64.25 W). Their result:
- The magnetic characteristic height h_L varies by about ±1 km over the solar cycle, with fluctuations of roughly ±1.6 km in individual field components.
- An increase in the 10.7 cm solar radio flux index (I_10.7) by about 150 units raises the first SR frequency by about 0.1 Hz and elevates h_L by about 2.5 km.
- The electric characteristic height h_C (same as h_E in the Greifinger notation) varies much less than h_L over the cycle.
Earlier work by Williams and Satori (2007, Radio Science 42) on the combined diurnal, 27-day (solar rotation), and 11-year timescales showed that order-of-magnitude changes in ionising radiation are needed to produce roughly 10% relative changes in ionospheric height. This scaling is consistent with both the flare-scale and cycle-scale responses.
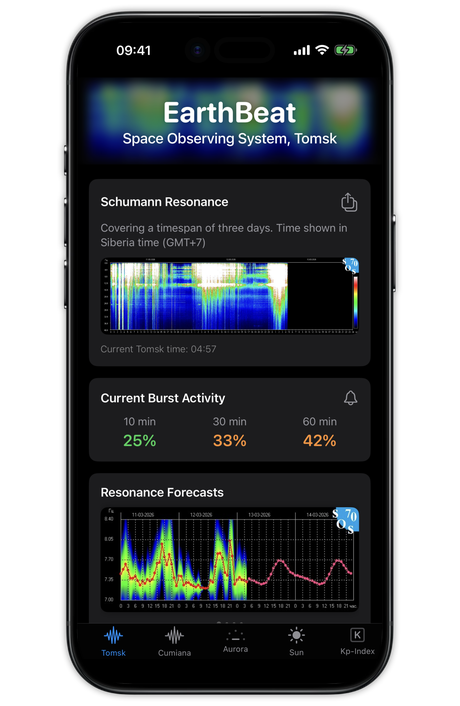
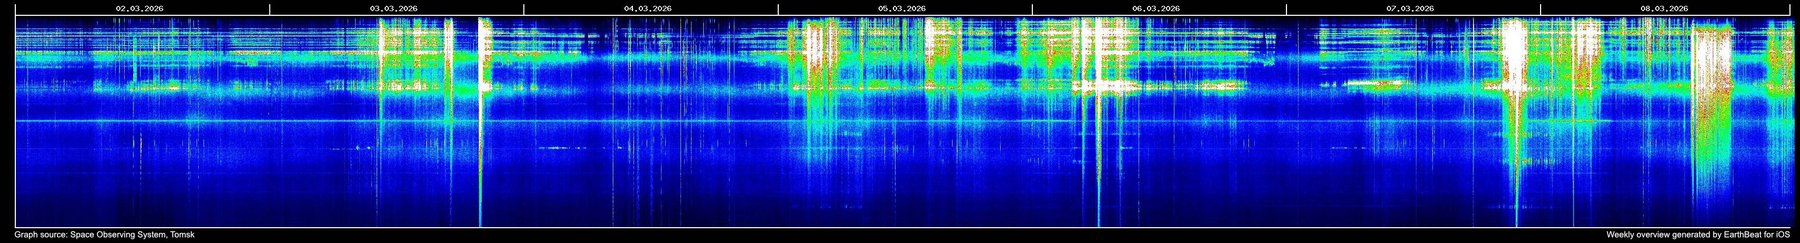
How to See It in EarthBeat
The flare signatures that appear in EarthBeat's graphs are real, but three caveats apply when reading them.
Station geometry matters. The stations that feed EarthBeat (Tomsk and Cumiana) are at mid-to-high northern latitudes. Their measurements are most sensitive to flares in the afternoon UTC window, when their local ionosphere is illuminated. A flare that peaks during local night at a given station will still modify that station's resonance frequencies (because the cavity is global), but the amplitude response can look different.
Intensity and frequency tell different stories. X-ray bursts change the frequency more clearly than the intensity. Solar Proton Events change the intensity noticeably as well, because deep D-region ionisation increases ELF attenuation.
Overlap with geomagnetic storms. A CME that launches with an X-class flare will produce an X-ray SID first, then (possibly) a proton event, then (possibly) a geomagnetic storm 1 to 3 days later. The signatures do not necessarily align on the graph, because they act through different physical channels.
To confirm whether a spike on EarthBeat is flare-related rather than lightning-related, the fastest independent check is the GOES X-ray flux curve published by NOAA SWPC. A C-class or stronger flare peak within a few tens of minutes of a visible SR shift is the most common cause of a clean frequency excursion.
Summary
- Solar flares modify the Schumann resonance on timescales of minutes to hours, through two distinct pathways: soft X-rays and energetic protons.
- X-ray bursts ionise the upper D-region (roughly 70 to 80 km), lower the magnetic characteristic height h_L, and push the SR frequencies up by a few tenths of a Hz for an X-class event.
- Solar proton events ionise the lower D-region (roughly 50 to 60 km), mostly in the polar caps, lower the electric characteristic height h_E, and push the SR frequencies down.
- The opposite signs of these two responses are a clean experimental confirmation of the two-layer (Greifinger-Greifinger) model of the cavity.
- Across the 11-year solar cycle, an increase of about 150 units in the solar 10.7 cm radio flux raises the first SR frequency by about 0.1 Hz and the magnetic characteristic height by about 2.5 km (Nickolaenko et al. 2025).
The effects are real, they are measurable at every high-quality SR observatory, and they are one of the better-understood aspects of the Schumann resonance. They do not involve resonance amplitudes that are dangerous to any biological system: the SR signal stays in the picotesla range. What changes during a flare is the frequency and the quality factor of a naturally-present signal, not its absolute intensity as a field.