The Physical Mechanism
The Schumann resonance is a cavity oscillation. Lightning strikes excite electromagnetic waves in the extremely low frequency range, and those waves become trapped between the conductive Earth and the conductive lower ionosphere. The cavity is not a rigid box. Its upper boundary is a diffuse layer of ionised gas whose conductivity profile changes continuously with solar and geomagnetic activity.
The specific layer that matters for the Schumann resonance is the D-region, at roughly 60 to 90 km altitude. During the day, solar UV and X-rays sustain a modest level of ionisation there. At night, the D-region thins and rises. Geomagnetic storms add a different kind of disturbance: energetic particles precipitate along magnetic field lines, especially at high latitudes, and those particles ionise additional D-region molecules. The net effect is a D-region that is denser, more conductive, and with a shifted altitude profile during storm conditions.
A cavity with different wall conductivity resonates differently. Both the quality factor (how sharp the resonance peaks are) and the peak frequencies respond. Cherry (2002), in a review published in Natural Hazards, linked the Schumann resonance signal directly to the D-region mechanism and reported high correlations with sunspot number and the Kp index across long time series.
What the Data Shows
Several studies have measured the storm-time effect on Schumann resonance parameters at specific observatories.
Amplitude increases during storms. Rodriguez-Camacho et al. (2018), using data from the Coeneo station in Mexico, compared geomagnetically quiet days with disturbed days across five 14-day windows between 2015 and 2017. They found a statistically significant increase (above 1 sigma) in the averaged amplitude of the first three Schumann resonance modes (approximately 7.8, 14.2, and 19.6 Hz) during the disturbed days. The effect was consistent across all five storms analysed.
Frequency shifts at specific harmonics. Oren et al. (2021), working with five months of 2016 data, computed correlation coefficients between Schumann resonance peak frequencies and both the Dst and Kp indices. The strongest coupling was at 7 Hz for Kp (correlation coefficient around -11.6 percent) and at 35 Hz for Dst (around -12.4 percent). The values are modest but statistically real.
Broader spectral effects during extreme storms. During the most severe storms (Kp 7 to 9), the Schumann resonance spectrogram can show a general loss of clarity: resonance peaks broaden, background noise rises, and the characteristic harmonic structure becomes harder to resolve. This is consistent with large disturbances in cavity geometry and conductivity.
Biological cross-signals. McCraty et al. (2017), in a HeartMath Institute study published in the International Journal of Environmental Research and Public Health, reported correlations between human heart rate variability and several space weather measures including the Kp index, the Ap index, and Schumann resonance power, across a 31-day monitoring period with 10 subjects. The mechanism proposed was resonant coupling between physiological rhythms and the combined geomagnetic and Schumann signals. This is a specific, peer-reviewed result that bridges the scientific measurements into the awareness literature.
What the Literature Does Not Say
Several online sources overstate the connection. The peer-reviewed record does not show the Schumann resonance "spiking" in lockstep with every Kp excursion, nor a dramatic rising trend over years. Some studies find only weak or non-significant correlations in specific windows. The amplitude effect is real but measured against a noisy baseline driven by thunderstorm activity, diurnal cycles, and seasonal variations.
A responsible reading of the evidence is this: geomagnetic storms measurably affect the Schumann resonance at the amplitude and frequency level, the effect is consistent across independent stations and decades of measurements, and the magnitude of the effect is modest and requires statistical analysis to separate from other sources of variation.
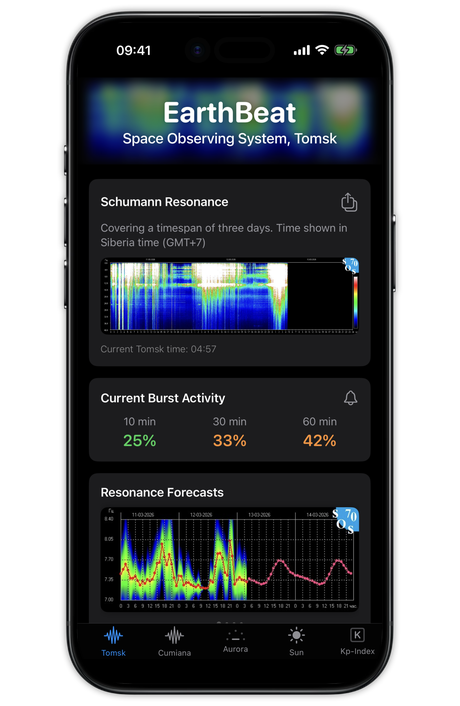
How to Observe It in EarthBeat
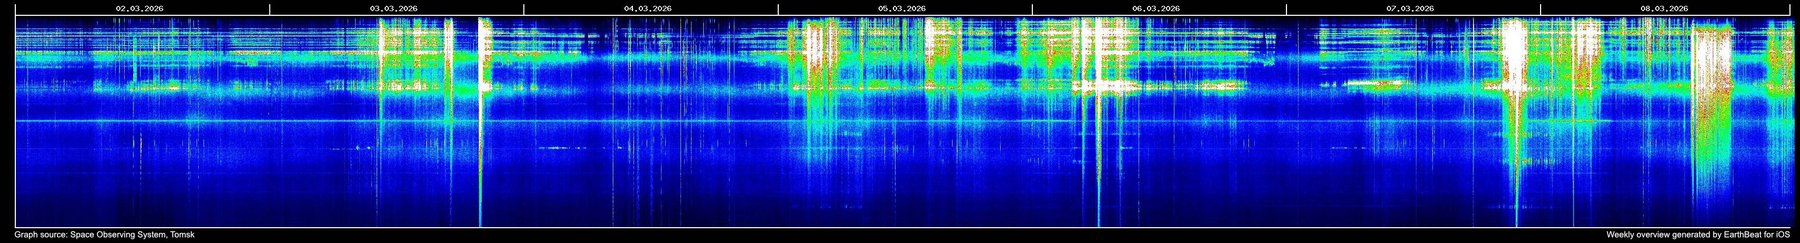
EarthBeat displays the Schumann resonance spectrogram from the Tomsk Space Observing System alongside the current and forecast Kp index from NOAA's Space Weather Prediction Center. EarthBeat Pro subscribers also see the weekly Schumann resonance overview, which assembles seven consecutive daily spectrograms into one continuous image. Weekly overviews are where storm signatures become easiest to spot, because a single day's ionospheric disturbance stands out against the surrounding baseline.
To observe the connection in practice:
- Watch for a Kp forecast above 4 or 5, or an incoming coronal mass ejection flagged on the solar activity screen.
- Note the date and UTC time of the expected arrival.
- Compare the Schumann resonance spectrogram during that window with the spectrogram from the preceding quiet day.
- Over a week or more of such events, the pattern becomes visible: elevated amplitude in the resonance bands, occasional broadening of the peaks, and burst activity that aligns with the Kp peaks.
The AI Current Reading feature, available to EarthBeat Pro subscribers, takes both the Schumann resonance data and the Kp index into account when generating its three-hourly summary in nine languages.
Summary
The Schumann resonance and the Kp index are linked through the physics of the ionosphere. Geomagnetic storms, measured by Kp, change the D-region conductivity that forms the upper wall of the Schumann resonance cavity, and the signal responds with measurable amplitude and frequency shifts. The correlations reported in peer-reviewed studies are modest but real. EarthBeat shows both signals together, which is the minimum viable setup for recognising the connection with your own eyes.