What the GCP Is
The GCP grew out of work at the Princeton Engineering Anomalies Research lab (PEAR), which from 1979 to 2007 ran experiments testing whether focused human intention could influence the output of hardware random number generators. The laboratory studies reported small but statistically consistent effects across many replications. Roger Nelson, a cognitive psychologist who coordinated the PEAR research programme, proposed extending the approach from individuals in a laboratory to groups of people responding to events in the world.
The first formal tests of this extension used a method called FieldREG, in which a portable random event generator was taken to a site of focused group attention (therapy sessions, theatre performances, religious rituals) and the data examined for deviations during the event. In January and September 1997, FieldREG was extended globally during two web-promoted meditations, the second of which coincided with the funeral of Diana, Princess of Wales. The reported deviations in those trial runs motivated construction of a permanent global network, which came online in August 1998.
Each node in the network runs a hardware random number generator based on electronic noise or quantum tunneling, producing one 200-bit trial per second. Bits are post-processed (usually XORed and whitened) to remove bias. The generators pass standard randomness tests (Diehard, NIST) on their unselected output. The research hypothesis is that when the data stream is sampled at pre-specified windows corresponding to designated "global events", the statistical deviations from expectation are larger than chance would predict.
The Experimental Protocol
The GCP's formal event experiment has three fixed steps.
First, an event is nominated in advance. The nomination includes the event's start and end times, the analytical statistic to be used, and the specific form of the deviation measurement. All of this is entered into a public prediction registry before the event data are examined.
Second, the event data are extracted from the archive and the pre-specified statistic is calculated. Eighty-four percent of the events use the same "standard analysis" statistic, which is algebraically equivalent to a pairwise correlation measure across the RNG nodes (Bancel & Nelson, 2008).
Third, the resulting event Z-score is combined with the Z-scores from all previous events to produce the running cumulative result. As of 2015, when the formal experiment closed, the running total stood at about Z = 7.31 across 500 events.
Every event is reported in the final statistics, whether its individual Z-score is positive, negative, or indistinguishable from chance. Most events show small deviations with modest individual significance. The cumulative deviation comes from the aggregate across many tests, not from a handful of dramatic individual results.
What the Record Shows
Over 500 formal events spanning 17 years, the cumulative Z-score is 7.31. The odds against chance for that cumulative deviation are greater than one trillion to one.
The most informative way to read the record is in aggregate. Any single event is too noisy to establish anything, which is one of the project's stated methodological points. The average event effect size is about 0.3 sigma, which is small. The cumulative signal appears only because the bias is consistent in direction across many events. Events correlated with widespread emotional response (tragedies, large celebrations, coordinated meditations) tend to produce positive deviations more often than chance would predict.
The record also shows internal structure that any explanation has to account for. The deviations are not uniform across all event types. Synchronised meditations produce particular patterns. News-driven disasters produce different patterns. The geographical distribution of eggs contributes non-uniformly. These second-order patterns are themselves the subject of active analysis.
September 11, 2001: The Iconic Case
On the morning of September 11, 2001, the network variance across the approximately 40 active eggs showed a cumulative deviation that Nelson, Radin, Shoup and Bancel (2002) analysed in detail in Foundations of Physics Letters. Their pre-specified test yielded a p-value of 0.003 for the day. A related analysis by Dean Radin using per-egg t-scores and squared Z-scores produced a similar direction of effect.
Independent analysis by Edwin May and S. James Spottiswoode reached a different conclusion. Using alternative methods and alternative time windows, they reported that the Sept 11 effect did not survive reanalysis and was sensitive to the specific window choice made in the original paper. This critique is often cited in the skeptical literature and is one of the reasons the GCP did not rely on Sept 11 as its headline result. The project position has since been that the 500-event cumulative result, not any single event, is the evidence that matters.
The Interpretation Problem
The existence of the cumulative deviation is not in serious dispute among people who have worked with the data. The interpretation is.
Option 1: Field-like global consciousness (GC). The original motivating hypothesis. Widespread human emotion produces a physical field-like effect that alters the statistical behaviour of random processes. The implication is that the effect should appear in any similar network, whether the experimenters were involved or not, and should appear for any suitably large-attention event, whether formally tested or not.
Option 2: Goal-oriented experimenter effect (GO). Proposed in the GCP context by Peter Bancel. The effect is real but is associated with the people who set up the experiment, not with the world population. Experimental outcomes conform to the goals of the experimenters through an anomalous mind-matter interaction at the level of design and analysis choices, not through a field acting on human populations. This model predicts that the effect should appear only in the GCP network and only for events the experimenters cared about, and that the effect size should be unusually constant across very different event types (consistent with an experimenter-level process rather than a population-level process).
Option 3: Artefact, bias, or statistical selection. The skeptical interpretation. The cumulative Z accumulates through subtle methodological choices, unconscious pattern matching, or selection effects in which events and analytical windows are chosen in ways that favour positive results. Critics including Robert Carroll, Jeffrey Scargle, and Brian Dunning have argued variants of this position. The GCP team responds that the pre-registration protocol, the public data archive, and the inclusion of all registered events in the final statistics address most of these concerns, though not all.
Bancel (2017) published a detailed 17-year reanalysis in EXPLORE. His conclusion, as a GCP insider who had co-authored the 2002 Foundations of Physics Letters paper and worked on the project for many years, was that the data do not distinguish between GC and GO, and that on grounds of parsimony (because GO effects are well-documented in prior RNG literature whereas field-like GC effects are not), GO is the more defensible interpretation. Roger Nelson responded in the same issue, arguing that field-like effects remain consistent with the data and that an adequate model will likely need to include both GO and field components.
The interpretation debate is genuine and unresolved. It is worth taking seriously both the result and the disagreement about what it means.
Recent Developments
Two lines of work have extended the original project.
GCP 2.0. In the years after the formal 17-year experiment concluded in 2015, the Institute of Noetic Sciences and HeartMath Institute initiated a second-generation network with improved sensor hardware and a larger distribution of nodes. GCP 2.0 operates with updated statistical protocols and integrates sensor data with the HeartMath Global Coherence Initiative's magnetometer network. Results from GCP 2.0 are published periodically on the HeartMath research portal. EarthBeat's live Network Coherence indicator is read from the GCP 2.0 feed.
Anomalous entropic analyses. Dean Radin (2022) published an exploratory paper in Entropy analysing 23 years of continuously recorded GCP-style data using information-theoretic measures. The analysis identified deviations from expected random behaviour at longer timescales than the original event protocol examined. This does not settle the GC versus GO question, but it extends the empirical record the interpretation has to explain.
Independent replications. Multiple researchers outside the GCP team have conducted analyses using the open GCP archive, including analyses of market volatility and internet search data. Some report positive correlations with the GCP signal. Others report null results. The replication landscape is mixed.
What EarthBeat Shows
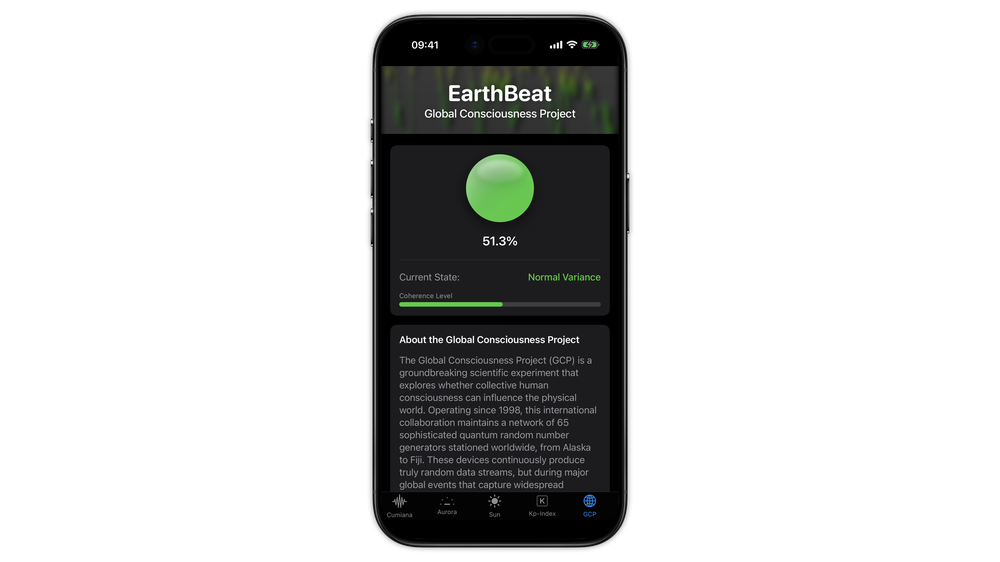
EarthBeat displays the current state of the GCP network as a live Network Coherence indicator, pulled from the ongoing GCP 2.0 data feed. The indicator shows how much the recent network-wide variance deviates from what chance would produce, mapped onto a five-band color scale from Normal to Extreme.
What the indicator is not: a validated interpretation. The indicator shows the data as it is recorded. Whether a given deviation is caused by focused human attention somewhere in the world, by a statistical coincidence, or by any other mechanism is a question EarthBeat cannot and does not answer. That is the job of the underlying research, which as of this writing remains contested even among the researchers who produced the data.
EarthBeat's position is to show the live signal honestly, link to the primary research, and let the reader decide what, if anything, to make of it.
Summary
The Global Consciousness Project ran a carefully designed, pre-registered, replication-based experiment for 17 years using a globally distributed network of random number generators. The cumulative result departs from chance by about seven standard deviations across 500 formal event tests. Several interpretations are on the table: a field-like global consciousness, a goal-oriented experimenter effect, or statistical artefact. The most rigorous insider analysis, by Peter Bancel in 2017, concluded the evidence better fits the experimenter-effect interpretation. The project director maintains that field-like models remain viable. EarthBeat shows the live signal, points readers at the peer-reviewed literature, and declines to take a position on the interpretation question because the research community itself has not settled it.