What the Instruments Have Actually Measured Since 1960
Schumann predicted the resonance theoretically in 1952. Martin Balser and Charles Wagner confirmed it experimentally in 1960 at the MIT Lincoln Laboratory. The first continuous measurements at West Greenwich, Rhode Island, began in the late 1960s. Nagycenk in Hungary started recording in 1993. Moshiri in Japan, Akademik Vernadsky in Antarctica, Hornsund on Svalbard, Eskdalemuir in the UK, Alberta in Canada, Boulder Creek in California, and sites in Israel joined the international network through the 1990s and 2000s.
Across all of these stations, spanning six decades, the first mode fundamental has sat in a narrow band centred near 7.83 Hz. The band is narrow but not a fixed line. Daily fluctuations of 0.3 to 0.5 Hz are normal and reflect:
- Lightning activity in the three tropical chimneys (Amazon basin, central Africa, Maritime Continent). The peak frequency shifts depending on the distance between the active chimney and the observing station.
- Day-night asymmetry in the ionospheric cavity. The sunlit side compresses, the dark side expands, and the cavity geometry the waves traverse is not symmetric.
- Solar X-ray and EUV flux, which changes D-region ionisation on timescales from hours to years.
- Geomagnetic activity, which modifies the upper cavity wall.
None of these variations adds up to a long-term upward drift. They average out over weeks and months, and the central value stays where it was in 1960.
Yes, There Is a Real Long-Term Variation: the 11-Year Solar Cycle
The one genuine long-term trend in the Schumann resonance is the 11-year solar cycle modulation. It is real, documented, modest in amplitude, and has been understood in the research literature for about two decades.
The mechanism is straightforward. The Sun's X-ray and EUV output varies by orders of magnitude over the solar cycle (more during solar maximum, less during solar minimum). That radiation ionises the D-region of the ionosphere, the layer that caps the Schumann resonance cavity. When solar activity is high, the D-region is more ionised, its effective height shifts, and the cavity geometry changes slightly. Because the resonance frequency depends on cavity geometry, it shifts with it.
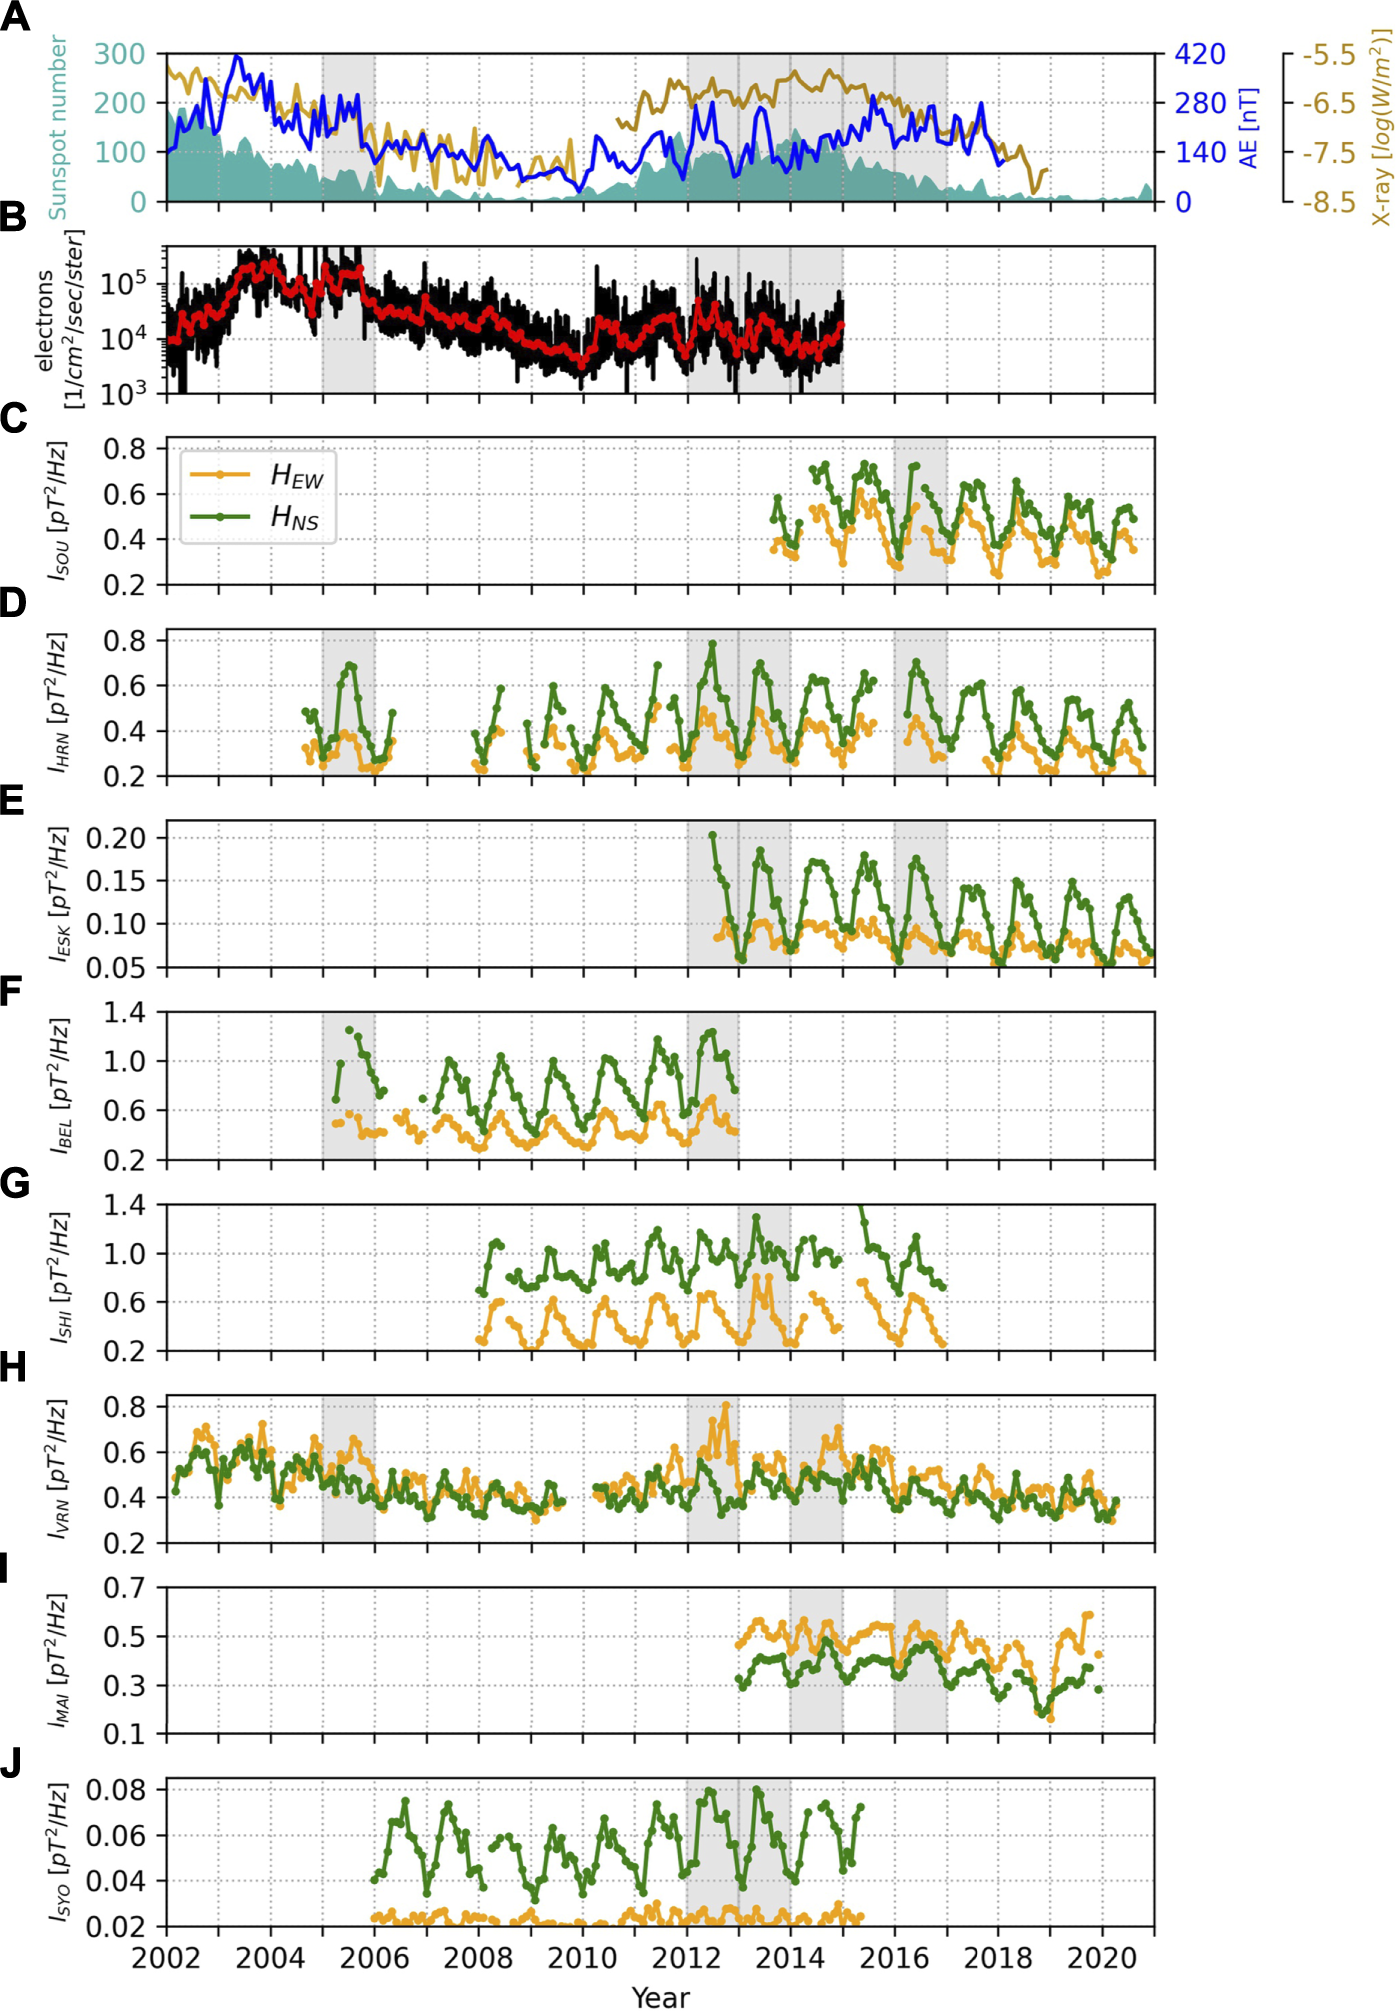
Source: Bozoki et al., Frontiers in Earth Science, 2021 (CC-BY 4.0)
The quantitative work on this is clearest in recent papers.
Satori, Williams & Mushtak (2005) first documented the 11-year signature across multiple stations in the Journal of Atmospheric and Solar-Terrestrial Physics. The frequency changes were small, consistent across stations, and in phase with the solar cycle.
Williams (2007) in Radio Science put together the physical model: ionospheric height changes of up to 10 percent can be produced by solar radiation on diurnal and 11-year timescales, and these height changes translate into the observed SR frequency variations.
Nickolaenko, Koloskov et al. (2015), using 10 years of data from the Akademik Vernadsky Antarctic station, attributed interannual SR variations to 1 to 2 km alterations in the knee height of the ionosphere, driven by solar activity.
Bozoki et al. (2021) in Frontiers in Earth Science showed that high-latitude stations are more strongly affected than mid-latitude stations, and introduced the role of energetic electron precipitation (EEP) at high latitudes in the solar-cycle modulation of cavity height.
Nickolaenko, Galuk, Hayakawa and colleagues (2025) in Atmosphere analysed 22 years of continuous Antarctic data (2002 to 2024, two full solar cycles) and produced a practical rule: an increase in the solar radio flux index I10.7 by about 150 units raises the first Schumann resonance frequency by about 0.1 Hz, and raises the magnetic characteristic height by about 2.5 km.
Han et al. (2023) in JGR Atmospheres, using 10 stations in the Chinese ELF network, confirmed the 11-year pattern and showed it is also modulated by El Nino events (the 2015/16 super El Nino produced a strong intensity signature on top of the solar-cycle modulation).
What does this mean in practice? Over an 11-year solar cycle the fundamental frequency oscillates by roughly 0.1 Hz around 7.83 Hz. During solar maximum it sits slightly higher. During solar minimum it sits slightly lower. It returns. It does not accumulate a trend across multiple solar cycles. The oscillation is about an order of magnitude smaller than the daily variation driven by lightning geography.
Where the "Rising Frequency" Claim Comes From
The "Schumann resonance is rising" claim has a traceable online history. It began appearing in New Age and wellness communities in the mid-2010s, often citing misread online spectrograms from amateur monitoring sites. Wikipedia's dedicated entry on Schumann resonances conspiracy theories documents the spread and judges the claim false on physical grounds, noting that scientific fact-checkers and atmospheric physicists have contradicted it wherever it has appeared in sourced writing.
The claim is usually one of three variants:
Variant 1: "The fundamental has risen from 7.83 to 30+ Hz." This is a misreading of spectrograms that display multiple modes. The fundamental is still at 7.83 Hz. The second mode is at 14 Hz, the third at 20 Hz, the fourth at 27 Hz, the fifth at 33 Hz. A bright band at 33 Hz on a spectrogram is not the fundamental shifting. It is the fifth harmonic, which has always been there, showing through more clearly because of amplitude variation.
Variant 2: "The frequency is spiking." What spikes during strong lightning activity or geomagnetic disturbance is usually amplitude (power), not frequency. The amplitude can double or triple in hours. The frequency stays put. Misreading colour intensity on a spectrogram as frequency movement is the most common source of this claim.
Variant 3: "Earth's heartbeat is accelerating." The literal frequency of the fundamental has not accelerated. The image of a "heartbeat" is a metaphor, not a measurement. The actual numeric value, averaged over weeks to years, is near 7.83 Hz and has been since 1960.
None of the three variants correspond to anything that the peer-reviewed record has observed.
Amplitude vs Frequency: The Confusion at the Heart of the Meme
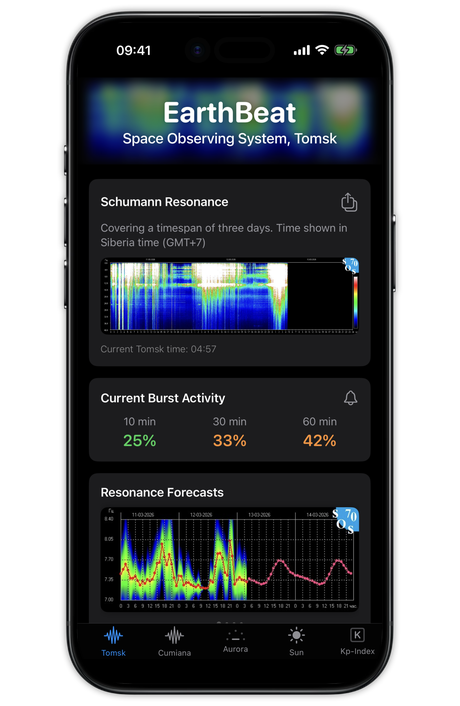
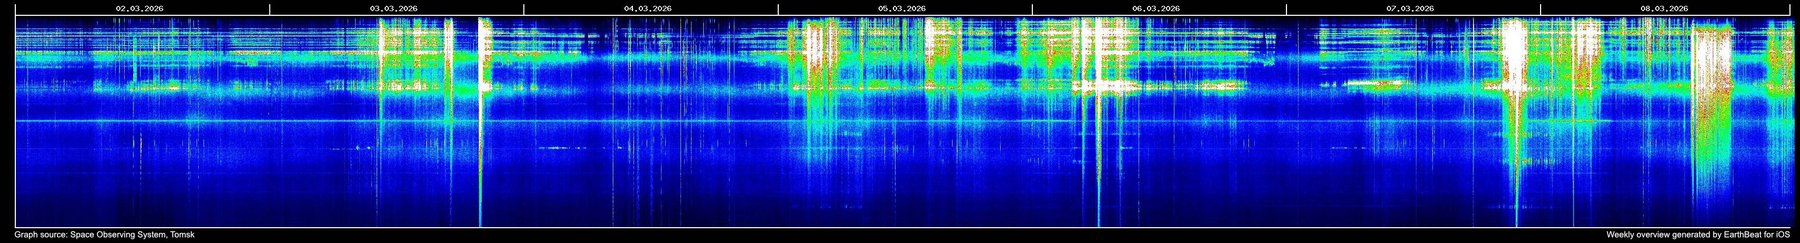
Most of the "rising Schumann resonance" content shared on social media is built around screenshots from public monitoring pages, most commonly the Tomsk Space Observing System. These pages display the signal as a spectrogram: frequency on one axis, time on the other, power (intensity) as colour.
When a strong thunderstorm or a geomagnetic disturbance produces a lot of energy in the cavity, the colours get brighter. This is an amplitude increase. It can be dramatic. Amplitudes can triple or more in short windows. The horizontal position of the bands (the frequency) does not change.
A viewer who reads colour brightness as frequency will conclude the frequency is changing. It is not. Tomsk's own documentation notes that black vertical bars on its spectrograms mark data gaps (periods when the instrument was offline for maintenance), not geophysical events. That documentation is widely ignored in viral content.
The distinction is important because the amplitude variations are real and interesting. They do track lightning activity, geomagnetic storms, and in some studies human physiological effects. But they are not frequency variations. Treating them as frequency variations conflates two separate physical measurements.
The Related Claims
Several claims are often bundled with the "rising frequency" idea. Each one deserves a brief, specific rebuttal.
"Time is speeding up." Earth's rotation is measured continuously by atomic clocks at the International Earth Rotation and Reference Systems Service (IERS). Day-length variations are on the order of milliseconds per day and driven by angular momentum exchange between the atmosphere, oceans, and solid Earth. The claim that a 24-hour day "feels like" 16 hours has no basis in either the atomic-clock record or in any peer-reviewed study of the Schumann resonance.
"Consciousness is shifting because of the frequency change." The frequency has not changed. Even if it had, the peer-reviewed research on SR-body interactions (see the body page) shows small, transient, intermittent effects on EEG and heart rate variability at existing SR frequencies. No mechanism exists in the published literature by which a non-existent frequency shift would drive a population-wide consciousness change.
"The Schumann generator bracelet will protect you from the shift." No peer-reviewed study has demonstrated clinical efficacy for consumer "Schumann resonator" devices. A single 40-patient clinical trial (Chen et al., 2022) showed sleep improvements from a specific laboratory device under double-blind conditions. That is different from consumer marketing claims for wearable products.
"Whiteouts on the spectrogram mean a global awakening." A whiteout (the entire spectrogram saturating bright) usually means either a strong nearby electromagnetic disturbance (a local thunderstorm, a power-line artefact, a magnetometer glitch) or a data-processing issue at the monitoring station. Tomsk's own operational notes describe these as equipment or environment events, not geophysical ones.
Why This Matters for Reading EarthBeat's Data
EarthBeat shows real live Schumann resonance data. Users sometimes see a bright band on the spectrogram, check it against a wellness-community interpretation online, and wonder what is happening.
What is happening, almost always, is this:
- An amplitude increase in one or more modes, driven by either lightning activity in one of the tropical chimneys or a geomagnetic disturbance.
- A small frequency shift within the normal daily range (a few tenths of a hertz), driven by the geometry of the station relative to where lightning is currently active.
- Either a perfectly quiet night or a noisy local electromagnetic environment at the source observatory.
What is not happening:
- A fundamental frequency shift from 7.83 to some other value.
- A planetary transition.
- A "rising" of Earth's electromagnetic heartbeat.
The Schumann resonance is interesting enough without embellishment. The real signal reflects global lightning activity in real time, tracks solar cycle modulation of the ionosphere, responds to geomagnetic storms, and occasionally shows the kinds of anomalies documented in the earthquake-precursor literature. Reading the data accurately opens up a rich window onto planetary electromagnetic behaviour. Reading it inaccurately closes that window and replaces it with a story.
Summary
The Schumann resonance fundamental frequency has not risen. Since instrumented measurement began in 1960, it has stayed near 7.83 Hz, with a small and well-documented 11-year solar-cycle oscillation of about 0.1 Hz as the only long-term variation in the peer-reviewed record. The "rising frequency" claim is a misreading of amplitude variations on public spectrograms, traced online to mid-2010s wellness communities and documented as false by scientific fact-checkers. Related claims about time acceleration and consciousness shifts have no physical basis. EarthBeat shows the real signal and encourages readers to understand what the display is actually measuring.