How the Kp Index Works
The Kp index was created by German geophysicist Julius Bartels in 1939. The "K" stands for "Kennziffer" (German for "characteristic digit") and the "p" stands for "planetarisch" (planetary). It remains the standard measure of global geomagnetic disturbance more than 80 years later.
Thirteen subauroral magnetometer stations (Menvielle & Berthelier, 1991), spread across the planet between roughly 44 and 60 degrees latitude, continuously measure variations in the local magnetic field. Each station calculates its own local K-index every three hours - eight values per day. These local K-indices are then standardized to remove station-specific biases and averaged to produce a single planetary number: the Kp index.
The scale is quasi-logarithmic, not linear. That means the jump from Kp 5 to Kp 6 represents a much larger increase in magnetic disturbance than the jump from Kp 1 to Kp 2. This is similar to how the Richter scale works for earthquakes. Kp 0 means the field is dead quiet. Kp 9 means an extreme geomagnetic storm is underway.
What the Numbers Mean
| Kp Value | NOAA Scale | Conditions | Aurora Visibility |
|---|---|---|---|
| 0-1 | - | Very quiet. No notable geomagnetic effects. | Unlikely except at very high latitudes |
| 2-3 | - | Quiet. Normal background fluctuations. | Visible above ~65° (Iceland, northern Scandinavia, northern Canada) |
| 4 | - | Unsettled. Minor magnetic fluctuations. | Expanding to ~60° (central Scandinavia, central Alaska) |
| 5 | G1 | Minor storm. Weak power grid fluctuations possible. Minor satellite orientation issues. | ~55° (southern Scandinavia, Scotland, southern Canada) |
| 6 | G2 | Moderate storm. Voltage alarms in high-latitude power systems. Increased drag on low-orbit satellites. | ~50° (northern Germany, northern UK, US-Canada border) |
| 7 | G3 | Strong storm. False alarms on protection devices. Surface charging on satellites. Intermittent HF radio issues. | ~50° (visible across much of northern Europe and northern US) |
| 8 | G4 | Severe storm. Widespread voltage control problems. Satellite tracking issues. HF radio propagation degraded. | ~45° (central US, central Europe) |
| 9 | G5 | Extreme storm. Grid collapse possible in some regions. Extensive surface charging on satellites. HF radio blackout for days. | ~40° or lower (southern US, Mediterranean, seen from places that almost never get aurora) |
Estimated vs Official Kp
Two versions of the Kp index exist, and they serve different purposes.
The estimated Kp comes from NOAA's Space Weather Prediction Center. It updates roughly every minute using real-time magnetometer data from a subset of stations. This is what you see in weather apps, aurora alerts, and space weather dashboards. It is designed for operational use - when you need to know conditions right now.
The official definitive Kp is computed by GFZ Potsdam using the complete global magnetometer network. It gets published with a delay of several days because all thirteen stations need to submit their data, and quality checks need to run. The definitive values are what scientists use in research papers.
Most of the time, the two agree closely. But during fast-moving events or when individual stations have data gaps, the estimated Kp can differ from the final official number by a point or more.
Why the Kp Index Matters
The Kp index is not just a number for aurora chasers. It feeds into decision-making across several industries and scientific fields.
- Aurora visibility - The most common use. Higher Kp pushes the auroral oval to lower latitudes, making the northern and southern lights visible to more people. Aurora forecast models use Kp as a primary input.
- Satellite operations - Geomagnetic storms increase atmospheric drag on low-orbit satellites, changing their orbits. During the May 2024 G5 storm, multiple Starlink satellites experienced significant drag increases. Spacecraft operators monitor Kp to plan orbit correction maneuvers.
- Power grid management - Geomagnetically induced currents (GICs) flow through long conductors like power lines during storms. Grid operators in high-latitude regions use Kp forecasts to prepare transformers and adjust operations before storms arrive.
- Aviation - Airlines reroute polar flights during strong geomagnetic storms because of increased radiation exposure at high altitudes and degraded HF radio communications. Kp is one of the indicators they monitor.
- GPS accuracy - Geomagnetic storms disturb the ionosphere, which affects the propagation of GPS signals. Precision applications like surveying and autonomous navigation can see accuracy degrade during high-Kp periods.
Summary
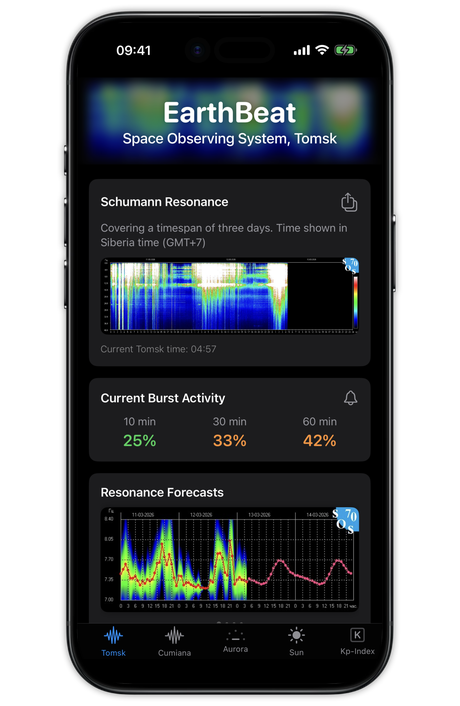
The Kp index remains the standard measure of planetary geomagnetic disturbance more than 80 years after its creation. Whether you are tracking aurora visibility, managing satellite operations, or monitoring space weather conditions, Kp provides a single number that captures the state of Earth's magnetic environment. EarthBeat displays the current Kp alongside solar wind and aurora data.