What Causes Geomagnetic Storms
A geomagnetic storm is formally defined as a time during which sufficiently intense and long-lasting interplanetary convection electric fields lead to strong injection of energy into the magnetosphere-ionosphere system (Gonzalez et al., 1994). Two types of solar events drive these storms, and they work differently.
Coronal mass ejections (CMEs) produce the strongest storms. A CME is a massive cloud of magnetized plasma launched from the Sun at speeds of 300-3,000 km/s. When it reaches Earth, the leading shock wave compresses the magnetosphere suddenly. If the CME's magnetic field is oriented southward (negative Bz), magnetic reconnection transfers enormous energy into the magnetosphere. The result can be a severe to extreme storm developing within hours.
CME-driven storms have a sudden onset. Ground magnetometers detect an abrupt jump called a sudden storm commencement (SSC) when the shock arrives. The main phase follows as ring current particles build up in the inner magnetosphere, weakening the field measured at the surface.
High-speed streams and corotating interaction regions (CIRs) produce weaker but more persistent storms. When fast solar wind from a coronal hole overtakes slower wind ahead of it, the compression zone can drive moderate geomagnetic activity for days. These storms tend to recur every 27 days as the coronal hole rotates with the Sun.
In both cases, the critical factor is the orientation of the interplanetary magnetic field. Southward Bz enables magnetic reconnection and energy transfer. Northward Bz blocks it. A fast, dense CME with northward Bz will compress the magnetosphere but produce little storm activity. A modest CME with strongly southward Bz can produce a severe storm.
The NOAA Storm Scale
NOAA's Space Weather Prediction Center classifies geomagnetic storms on the G1-G5 scale based on the Kp index, which measures planetary geomagnetic disturbance on a 0-9 scale:
| Level | Kp | Power Systems | Satellites | Aurora Visibility |
|---|---|---|---|---|
| G1 - Minor | 5 | Weak power grid fluctuations | Minor impact on satellite operations | ~55° geomagnetic latitude |
| G2 - Moderate | 6 | High-latitude voltage alarms | Increased drag on LEO satellites | ~50° geomagnetic latitude |
| G3 - Strong | 7 | Voltage corrections may be needed | Surface charging, tracking issues | ~50° geomagnetic latitude |
| G4 - Severe | 8 | Widespread voltage control problems | Orientation and tracking difficulties | ~45° geomagnetic latitude |
| G5 - Extreme | 9 | Grid collapse possible, transformer damage | Extensive charging, satellite damage or loss | ~40° or lower |
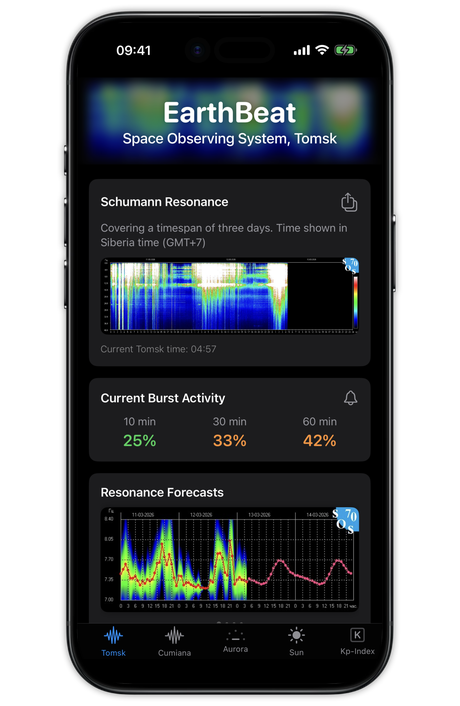
The Kp index is calculated every three hours from magnetometer data collected at 13 stations distributed around the world. An estimated Kp value, derived from a subset of stations, is available in near-real-time and is what EarthBeat displays.
Notable Storms in History
The Carrington Event - September 1-2, 1859
On September 1, 1859, British astronomer Richard Carrington was sketching sunspots when he witnessed an intense white-light flare - the first solar flare ever observed. Seventeen hours later, a CME slammed into Earth at extreme speed, having covered 150 million km in under a day.
The resulting geomagnetic storm was unlike anything before or since. Telegraph operators in the United States and Europe received electric shocks from their equipment. Some telegraph lines continued to operate even after operators disconnected the batteries - the induced currents were strong enough to power the system. Aurora was reported at latitudes as low as Colombia, Hawaii, and sub-Saharan Africa.
If a Carrington-class event happened today, the damage would be measured in trillions of dollars. A 2013 Lloyd's of London study estimated 20-40 million people in the US could face extended power outages, with full recovery taking 1-2 years for the most affected regions.
The Quebec Blackout - March 13, 1989
A powerful CME hit Earth's magnetosphere on March 13, 1989, producing a G5 storm. Within 92 seconds of the storm's intensification on March 13, 1989, the entire Hydro-Quebec power grid collapsed. Geomagnetically induced currents (GICs) tripped protective relays on the system's static VAR compensators, cascading into a full system failure.
Six million people lost power for up to nine hours. In the United States, a transformer at the Salem Nuclear Plant in New Jersey was permanently damaged by GICs. Over 200 anomalies were reported on satellites, and the Space Shuttle Discovery's onboard fuel cell readings fluctuated unexpectedly.
The 1989 storm drove major changes in how power utilities prepare for geomagnetic activity. Many grid operators now monitor GIC levels in real time and have procedures to reduce vulnerability during storm warnings.
The Halloween Storms - October-November 2003
A series of powerful solar events in late October and early November 2003 produced some of the most intense space weather of the modern satellite era. The Sun launched multiple X-class flares, including one estimated at X45 (the detectors saturated at X28, and the actual intensity had to be reconstructed from radio observations).
Multiple CMEs hit Earth in rapid succession. Japan's ADEOS-II satellite, a $640 million environmental monitoring spacecraft, was permanently disabled. The Swedish power grid experienced a transformer failure and localized blackout. GPS accuracy degraded severely. Airline routes were rerouted away from polar regions due to radiation concerns and HF radio blackouts.
The Halloween Storms served as a wake-up call. They demonstrated that even with modern forecasting, rapid-fire solar events could overwhelm both space weather services and the systems they protect.
The May 2024 G5 Storm
In May 2024, a series of CMEs from a large active region produced the first G5 (extreme) geomagnetic storm since the Halloween Storms of 2003. The Kp index reached 9, the maximum value on the scale.
The most visible effect was aurora. People across the continental United States, southern Europe, and parts of the Southern Hemisphere photographed vivid displays in shades of red, green, and purple. Social media filled with aurora photos from locations that rarely if ever see them.
The storm also demonstrated how much more space-weather-dependent the world had become in two decades. Satellite operators reported increased drag on low-Earth orbit spacecraft, GPS accuracy degraded, and HF radio communications were disrupted. But the power grid effects, while monitored closely, did not produce the catastrophic failures that some had feared - in part because of improved preparedness since 1989.
Summary
Geomagnetic storms are the end result of the Sun-Earth connection, and their effects range from beautiful aurora displays to serious infrastructure disruption. The NOAA G-scale provides a clear framework for understanding storm severity. EarthBeat monitors the Kp index and related parameters so you can follow storm conditions as they develop.