What Causes the Aurora
The Sun constantly blows a stream of charged particles into space. This solar wind travels at 300-800 km/s and carries its own magnetic field, called the interplanetary magnetic field (IMF). When this wind reaches Earth, most of it gets deflected by our magnetosphere. But some energy gets in, especially when conditions are right.
The key process is magnetic reconnection. On Earth's nightside, stretched magnetic field lines snap and reconnect, accelerating electrons and protons down along the field lines into the upper atmosphere. These particles hit gas molecules at altitudes between 100 and 300 km, transferring energy that gets released as light.
The colors depend on which gas gets hit and at what altitude. Oxygen at around 100-200 km produces the most common aurora color: green, at a wavelength of 557.7 nm. Higher up, above 200 km, oxygen produces a deep red glow at 630 nm. Nitrogen molecules contribute blue and purple tones, most visible at the lower edges of auroral curtains.
How to Predict Aurora Visibility
Three numbers tell you most of what you need to know. None of them alone is enough - you want to check all three.
1. The Kp Index
The Kp index measures overall geomagnetic disturbance on a 0-9 scale. Higher Kp pushes the auroral oval further from the poles, making the aurora visible at lower latitudes. This is the single most-used number in aurora forecasting. Kp 3 keeps the aurora near the Arctic Circle. Kp 7 brings it down to the northern US and central Europe.
2. IMF Bz Component
This is the north-south component of the interplanetary magnetic field, measured in nanotesla (nT). Earth's magnetic field points northward. When the IMF Bz points southward (negative values), the two fields can connect through magnetic reconnection, dumping solar wind energy into the magnetosphere. A Bz of -10 nT or below is a strong driver for aurora. When Bz is positive (northward), the magnetosphere stays relatively closed and aurora activity drops, even if solar wind speed is high.
3. Solar Wind Speed
Faster solar wind delivers more energy to the magnetosphere. Normal solar wind speed sits around 300-400 km/s. Speeds above 500 km/s are elevated. Above 700 km/s is fast. The combination of high speed and negative Bz is what produces the strongest geomagnetic storms and the most impressive aurora displays. Speed alone is not enough - you need that southward Bz to open the door.
Kp to Latitude Guide
This table gives approximate geographic latitudes where aurora becomes visible overhead or on the northern horizon. Actual visibility depends on local conditions, horizon obstructions, and how substorms distribute within the auroral oval.
| Kp Index | Approx. Latitude | Example Locations |
|---|---|---|
| Kp 3 | ~65° N/S | Tromso, Fairbanks, Reykjavik, northern Canada |
| Kp 5 (G1) | ~55° N/S | Edinburgh, Copenhagen, Calgary, southern Scandinavia |
| Kp 7 (G3) | ~50° N/S | London, Seattle, Prague, Hamburg, northern US states |
| Kp 9 (G5) | ~40° N/S | Madrid, Denver, Rome, central United States, central Europe |
Best Conditions for Viewing
Getting the space weather right is only half the equation. You also need the right conditions on the ground.
- Dark skies - Get away from city lights. Even a moderately bright aurora can be washed out by urban light pollution. Rural areas with a clear view to the north are ideal.
- Clear weather - Clouds block aurora completely. Check your local weather forecast before heading out. Partly cloudy skies can work if you are patient and the breaks align.
- Time of night - The statistical peak for auroral activity is around magnetic midnight, which is roughly local midnight for most mid-latitude locations. The window from 10 PM to 2 AM covers the best chances, though strong storms can produce visible aurora from dusk to dawn.
- Equinox advantage - March and September are slightly favored for geomagnetic activity due to the Russell-McPherron effect (Russell & McPherron, 1973). The geometry of Earth's magnetic field relative to the solar wind makes southward Bz statistically more likely during equinox months.
- Camera trick - Modern phone cameras can capture aurora that your eyes cannot see. If conditions look marginal, try a long-exposure photo aimed at the northern horizon. The camera sensor picks up colors and structures that are below the threshold of human night vision.
How NOAA Forecasts Aurora
NOAA's Space Weather Prediction Center uses several tools to forecast aurora activity.
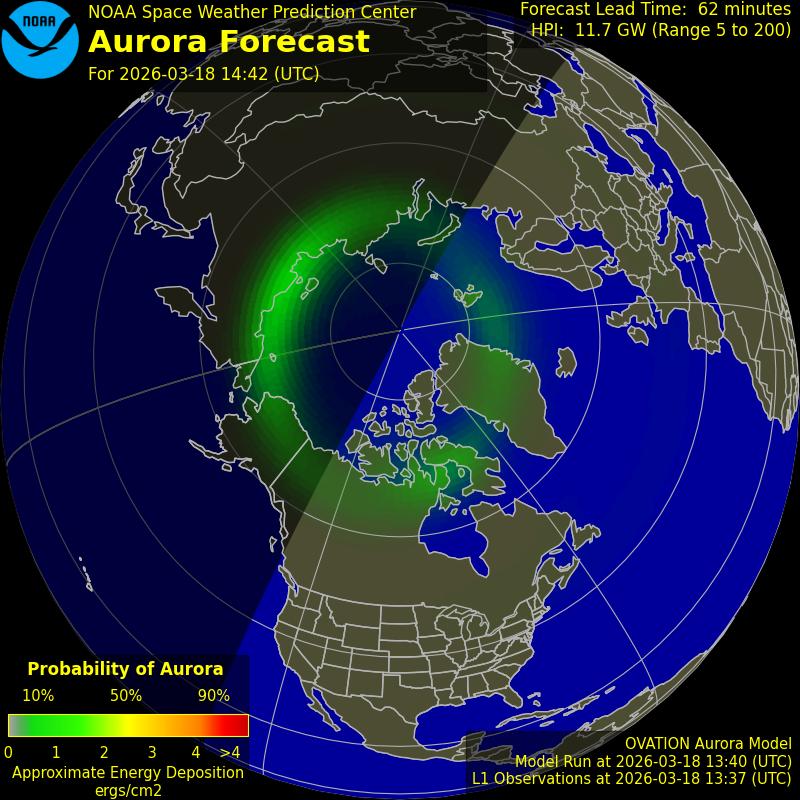
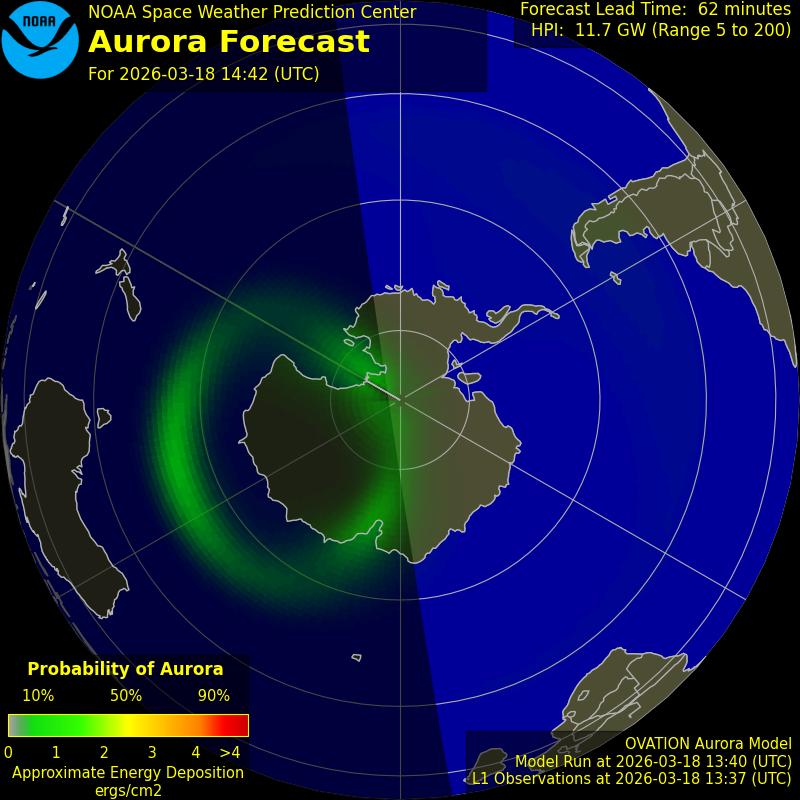
The OVATION model (Newell et al., 2010) (Oval Variation, Assessment, Tracking, Intensity, and Online Nowcasting) takes real-time solar wind measurements from the DSCOVR satellite at the L1 Lagrange point and calculates the current size, shape, and intensity of the auroral oval. It produces a probability map showing where aurora is likely visible. This is a nowcast - it shows conditions as they are, with about a 30-minute lead time based on solar wind transit from L1 to Earth.
For longer-range forecasts, SWPC watches for coronal mass ejections (CMEs) on the Sun. When a CME launches toward Earth, forecasters estimate its speed and arrival time, typically 1-3 days out. These forecasts carry significant uncertainty because CMEs can accelerate, decelerate, or deflect as they travel through the solar wind.
High-speed solar wind streams from coronal holes follow a 27-day recurrence pattern (one solar rotation). If a coronal hole produced elevated Kp on one pass, forecasters expect similar activity when that region rotates back to face Earth. These recurring streams are more predictable than CMEs and produce multi-day periods of moderate geomagnetic activity.
Summary
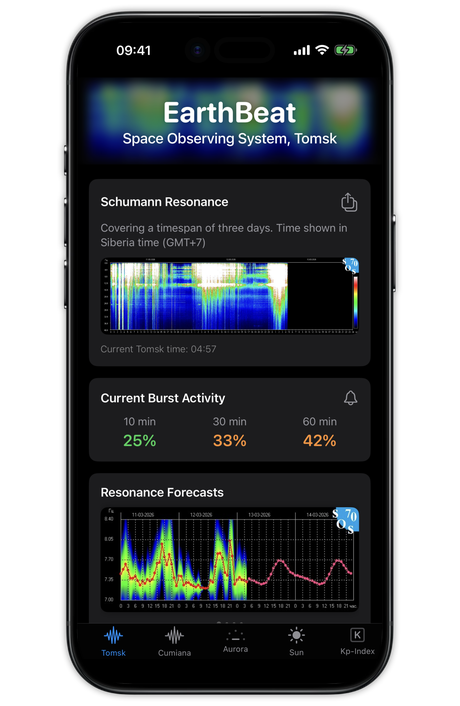
Predicting aurora visibility comes down to monitoring three numbers: the Kp index, the IMF Bz component, and solar wind speed. When all three align favorably, the chances of seeing the northern or southern lights increase significantly. EarthBeat provides all three measurements in real time, along with aurora forecast maps.