The Practice of Observation
Long before clocks, people organized their lives around natural patterns. Farmers planted by lunar phases. Sailors navigated by stars. Entire cultures structured their calendars around solstices and equinoxes.
This was not mysticism. It was practical attention. Noticing what the world was doing and adjusting accordingly.
Modern awareness practitioners carry this forward. The tools have changed. Instead of watching the sky, you might check an app. But the underlying impulse is the same: pay attention to the world around you, and see what you notice.
Some practitioners have added electromagnetic signals to this tradition. The Schumann resonance, geomagnetic indices, solar wind data. These are measurable, real signals that fluctuate throughout each day. Whether they affect you directly is an open question. But tracking them can become a meaningful part of a daily routine.
Natural Cycles People Track
Circadian Rhythms
Your internal 24-hour clock. This is established science. Every cell in your body runs on a circadian cycle, regulated by light exposure and governed by the suprachiasmatic nucleus in your brain. Disruptions to this rhythm, through shift work, jet lag, or screen exposure at night, have well-documented health effects. Of all the cycles on this list, this one has the strongest scientific foundation.
Lunar Phases
The moon completes a full cycle roughly every 29.5 days. Its gravitational pull drives ocean tides. Agricultural traditions worldwide have linked planting and harvesting to lunar phases. Whether the moon affects human biology directly is debated, but its cultural significance is undeniable. Many people find that tracking the lunar cycle adds a sense of larger rhythm to their week.
Seasonal Patterns
Daylight length, temperature, humidity, the behavior of plants and animals. Seasonal changes affect everything from mood to energy levels. Seasonal Affective Disorder is a recognized condition linked to reduced winter daylight. Paying attention to seasonal shifts is one of the oldest forms of environmental awareness.
Schumann Resonance
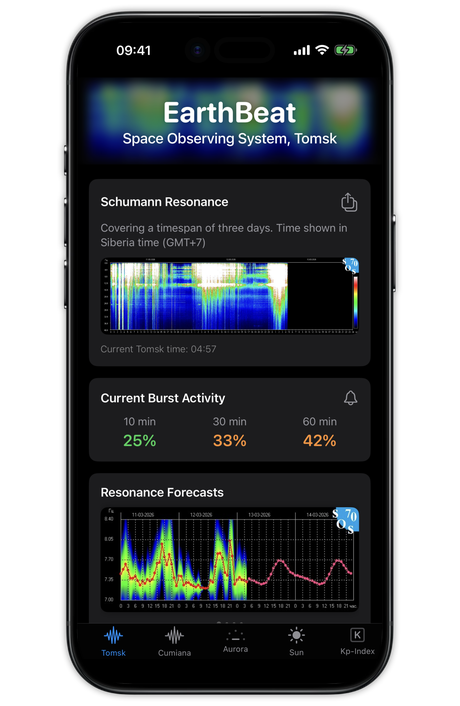
The newest addition to the observer's toolkit. Earth's electromagnetic background hum, driven by global lightning activity, peaks at around 7.83 Hz. The signal was first predicted in 1952 and confirmed in 1954. It is real physics. What draws the awareness community to it is the proximity of that frequency to the alpha brainwave range. Whether this overlap has biological significance is not established, but many practitioners track it daily alongside their meditation practice.
Geomagnetic Activity
Measured by the Kp index, geomagnetic activity reflects how much Earth's magnetic field is being disturbed by solar wind. Aurora watchers track Kp religiously, since values above 5 mean the northern lights might be visible at lower latitudes. Some researchers have explored correlations between geomagnetic storms and human cardiovascular health, but this research is still in early stages.
Building a Daily Awareness Routine
You do not need to track everything. Pick what interests you and start there.
A simple routine might look like this:
- Morning: Open EarthBeat. Check the Schumann resonance and Kp index. Takes about 30 seconds. Just notice the numbers.
- During the day: Pay attention to how you feel. Not obsessively, just with a light awareness. Are you energized or sluggish? Focused or scattered?
- Evening: Jot down a one-line note. What stood out today? Did anything in the data correlate with your experience?
- Weekly review: Look back at your notes alongside the historical data in the app. Patterns tend to emerge over weeks, not days.
The point is not to prove anything. It is to cultivate the habit of noticing. Over time, you build a personal record that no one else can create for you.
What the Data Means to You
The same data means different things to different people.
A physicist sees the Schumann resonance and thinks about waveguide propagation, ionospheric conductivity, and global lightning rates. A meditator sees it and thinks about rhythm, connection, and presence. An aurora photographer checks the Kp index hoping for a show in the sky.
All three are looking at the same numbers. None of them is wrong.
EarthBeat was built with this in mind. The app presents the same data through different lenses, so you can engage with it in a way that fits your perspective. The science does not change. Your relationship with it is yours to define.